Attachement du package : 'dplyr'Les objets suivants sont masqués depuis 'package:stats':
filter, lagLes objets suivants sont masqués depuis 'package:base':
intersect, setdiff, setequal, unionNous utilisons le registre de transparence de l’Union Européenne pour observer les caractéristiques des groupes d’intérêts qui interviennent auprès de la Commissions Européennes, et en particulier pour observer les différences entre les groupes qui sont dans des groupes d’intérêts et ceux qui ne le sont pas.
Commençons tout d’abord par détailler les données :
Nous nous appuyons sur les données publiées par l’Union Européenne à cette adresse : https://data.europa.eu/data/datasets/transparency-register?locale=en
On choisit de travailler sur les données de janvier 2024, car le format des données change à partir de ce point, et que certaines informations sont (encore) moins bien remplies, en particulier ce qui concerne les budgets, qui sont renseignés à la fois comme des chiffre bruts et à la fois commet des intervalles dans la même colonne et sont donc difficilement exploitables à partir de juin 2024.
On utilise aussi en parallèle les données nettoyées par LobbyFacts, qui permet de nettoyer des informations sur le nombre de temps pleins et sur les budgets : https://www.lobbyfacts.eu/
Attachement du package : 'dplyr'Les objets suivants sont masqués depuis 'package:stats':
filter, lagLes objets suivants sont masqués depuis 'package:base':
intersect, setdiff, setequal, unionOn créé une variable score basée sur le dernier quantile des variables quantitatives, et la présence de la modalité pour les variables dichtomiques :
Nombre d’ETP
Nombre de personne accrédité au PE
Nombre de RDV avec la CE
Nombre d’OPC
Nombre de ROADMAPS
Bureau à Bruxelles
A eu une bourse de l’UE
| Ressources par catégorie | ||||||||||||||
| En 2024 - Pourcentage ligne | ||||||||||||||
| Characteristic | Academic institutions N = 3351 |
Associations and networks of public authorities N = 1671 |
Companies & groups N = 3,2921 |
Entities, offices or networks established by third countries N = 21 |
Law firms N = 701 |
Non-governmental organisations, platforms and networks and similar N = 3,5401 |
Organisations representing churches and religious communities N = 461 |
Other organisations, public or mixed entities N = 4641 |
Professional consultancies N = 5201 |
Self-employed individuals N = 1291 |
Think tanks and research institutions N = 5641 |
Trade and business associations N = 2,6001 |
Trade unions and professional associations N = 9601 |
Overall N = 12,6891 |
|---|---|---|---|---|---|---|---|---|---|---|---|---|---|---|
| Members | 3.0 (1.0, 6.0) - max = 50.0) | 3.0 (1.0, 5.0) - max = 20.0) | 2.0 (1.0, 4.0) - max = 121.0) | 7.0 (6.0, 8.0) - max = 8.0) | 2.5 (1.0, 5.0) - max = 28.0) | 3.0 (2.0, 5.0) - max = 915.0) | 2.0 (2.0, 5.0) - max = 12.0) | 3.0 (2.0, 5.0) - max = 32.0) | 3.0 (1.0, 5.0) - max = 89.0) | 1.0 (1.0, 1.0) - max = 10.0) | 4.0 (2.0, 7.0) - max = 86.0) | 2.0 (1.0, 4.0) - max = 93.0) | 2.0 (1.0, 4.0) - max = 25.0) | 3.0 (1.0, 5.0) - max = 915.0) |
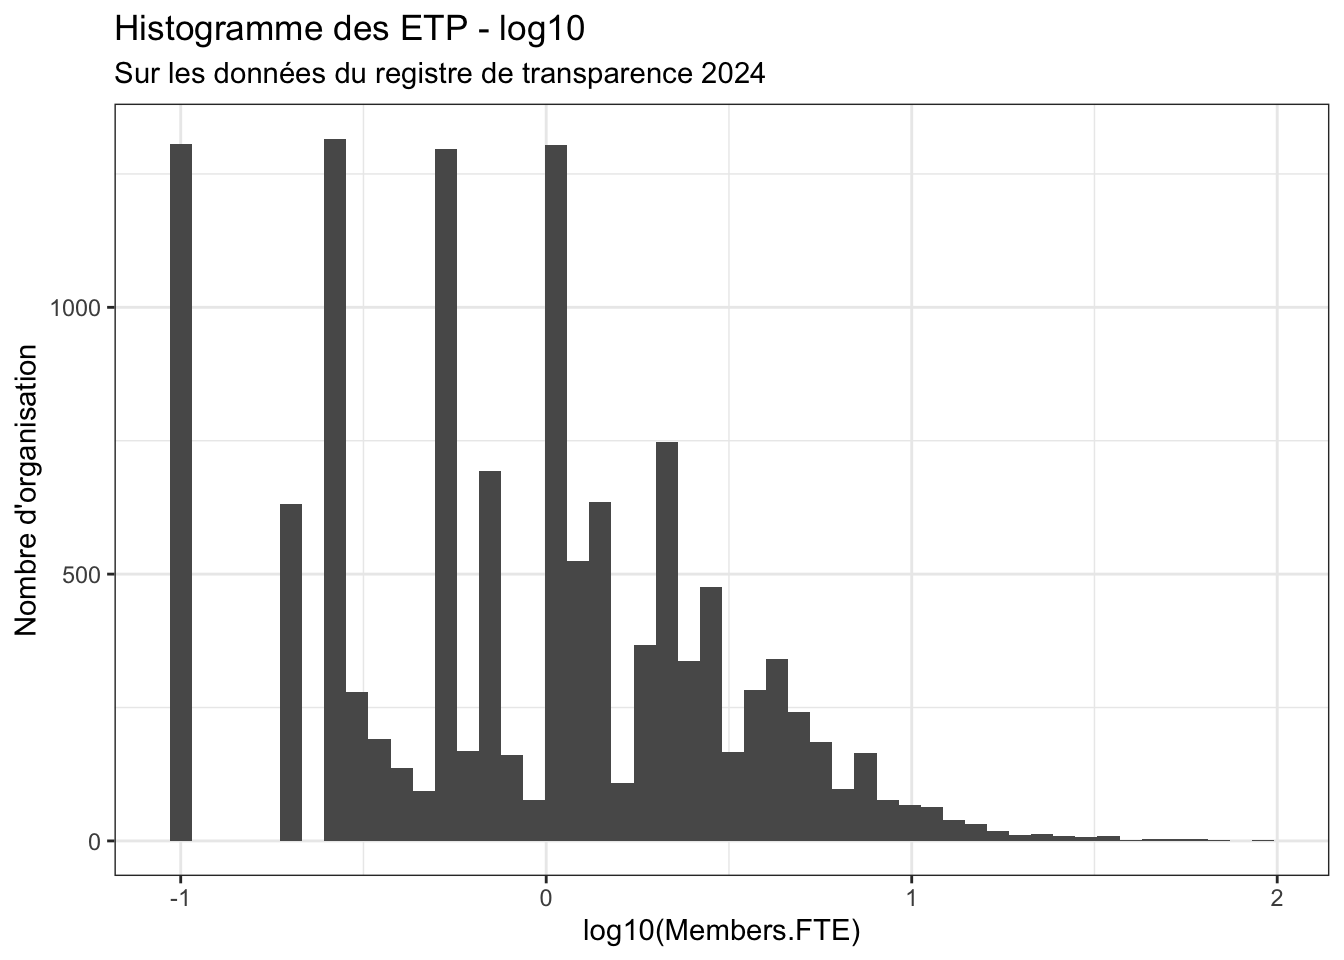
| Members.FTE | 1.00 (0.25, 2.00) - max = 25.00) | 1.00 (0.50, 2.25) - max = 14.00) | 0.50 (0.25, 1.50) - max = 36.85) | 4.00 (2.00, 6.00) - max = 6.00) | 0.50 (0.25, 2.25) - max = 20.00) | 1.00 (0.45, 2.50) - max = 91.50) | 1.00 (0.60, 2.30) - max = 8.50) | 1.00 (0.30, 2.25) - max = 24.00) | 1.00 (0.30, 3.10) - max = 71.00) | 0.75 (0.25, 1.00) - max = 2.00) | 1.25 (0.50, 3.23) - max = 60.00) | 1.00 (0.28, 2.00) - max = 46.00) | 0.75 (0.25, 1.50) - max = 19.00) | 0.95 (0.25, 2.00) - max = 91.50) |
| Number.of.EP.accredited.Person | 0.00 (0.00, 0.00) - max = 2.00) | 0.00 (0.00, 0.00) - max = 12.00) | 0.00 (0.00, 0.00) - max = 12.00) | 0.00 (0.00, 0.00) - max = 0.00) | 0.00 (0.00, 0.00) - max = 12.00) | 0.00 (0.00, 0.00) - max = 39.00) | 0.00 (0.00, 2.00) - max = 10.00) | 0.00 (0.00, 0.00) - max = 12.00) | 0.00 (0.00, 1.00) - max = 56.00) | 0.00 (0.00, 0.00) - max = 2.00) | 0.00 (0.00, 0.00) - max = 8.00) | 0.00 (0.00, 0.00) - max = 20.00) | 0.00 (0.00, 0.00) - max = 18.00) | 0.00 (0.00, 0.00) - max = 56.00) |
| Bruxel | ||||||||||||||
| 0 | 308 (3.2%) | 121 (1.3%) | 2,858 (30%) | 1 (<0.1%) | 35 (0.4%) | 2,685 (28%) | 19 (0.2%) | 377 (3.9%) | 313 (3.2%) | 105 (1.1%) | 447 (4.6%) | 1,678 (17%) | 727 (7.5%) | 9,674 (100%) |
| 1 | 27 (0.9%) | 46 (1.5%) | 434 (14%) | 1 (<0.1%) | 35 (1.2%) | 855 (28%) | 27 (0.9%) | 87 (2.9%) | 207 (6.9%) | 24 (0.8%) | 117 (3.9%) | 922 (31%) | 233 (7.7%) | 3,015 (100%) |
| In.forum.and.EU.platforms | ||||||||||||||
| 0 | 200 (2.9%) | 81 (1.2%) | 2,026 (29%) | 2 (<0.1%) | 46 (0.7%) | 1,640 (23%) | 24 (0.3%) | 249 (3.6%) | 385 (5.5%) | 92 (1.3%) | 278 (4.0%) | 1,429 (20%) | 561 (8.0%) | 7,013 (100%) |
| 1 | 135 (2.4%) | 86 (1.5%) | 1,266 (22%) | 0 (0%) | 24 (0.4%) | 1,900 (33%) | 22 (0.4%) | 215 (3.8%) | 135 (2.4%) | 37 (0.7%) | 286 (5.0%) | 1,171 (21%) | 399 (7.0%) | 5,676 (100%) |
| In_intergroup | ||||||||||||||
| 0 | 287 (2.9%) | 116 (1.2%) | 2,700 (27%) | 2 (<0.1%) | 64 (0.6%) | 2,500 (25%) | 20 (0.2%) | 350 (3.5%) | 433 (4.4%) | 109 (1.1%) | 451 (4.6%) | 2,110 (21%) | 718 (7.3%) | 9,860 (100%) |
| 1 | 48 (1.7%) | 51 (1.8%) | 592 (21%) | 0 (0%) | 6 (0.2%) | 1,040 (37%) | 26 (0.9%) | 114 (4.0%) | 87 (3.1%) | 20 (0.7%) | 113 (4.0%) | 490 (17%) | 242 (8.6%) | 2,829 (100%) |
| Has_EP_access | ||||||||||||||
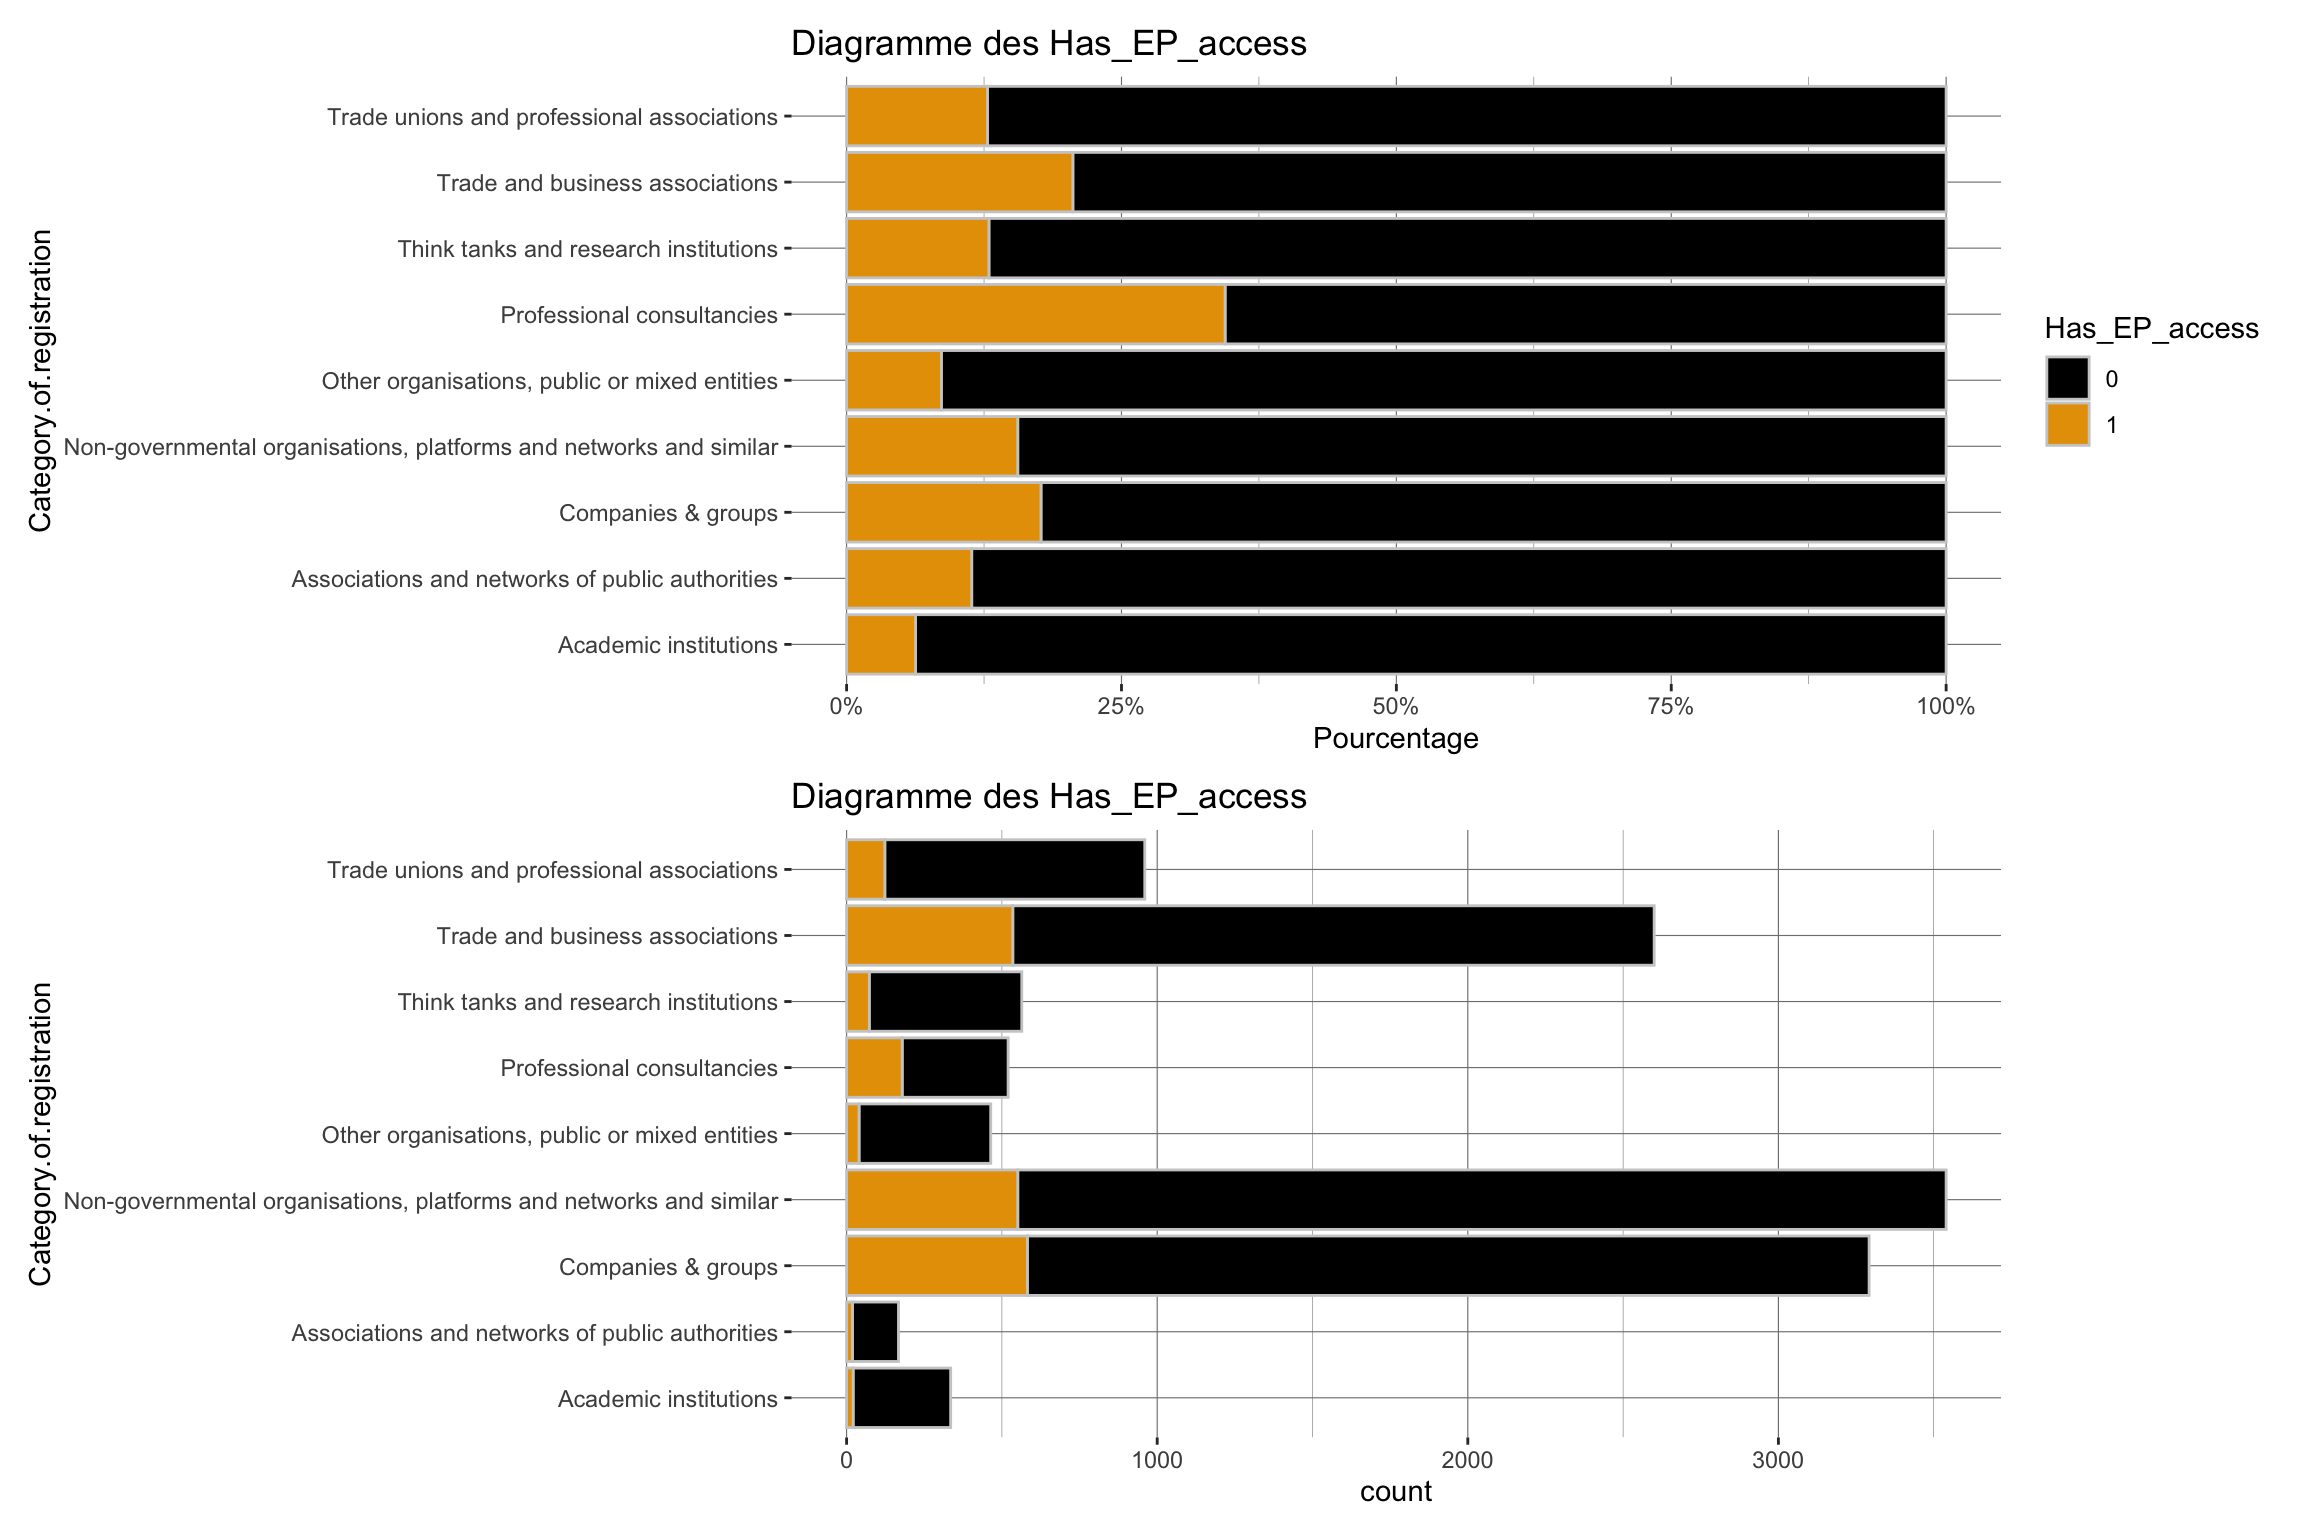
| 0 | 314 (3.0%) | 148 (1.4%) | 2,710 (26%) | 2 (<0.1%) | 55 (0.5%) | 2,989 (28%) | 24 (0.2%) | 424 (4.0%) | 341 (3.2%) | 102 (1.0%) | 491 (4.7%) | 2,065 (20%) | 837 (8.0%) | 10,502 (100%) |
| 1 | 21 (1.0%) | 19 (0.9%) | 582 (27%) | 0 (0%) | 15 (0.7%) | 551 (25%) | 22 (1.0%) | 40 (1.8%) | 179 (8.2%) | 27 (1.2%) | 73 (3.3%) | 535 (24%) | 123 (5.6%) | 2,187 (100%) |
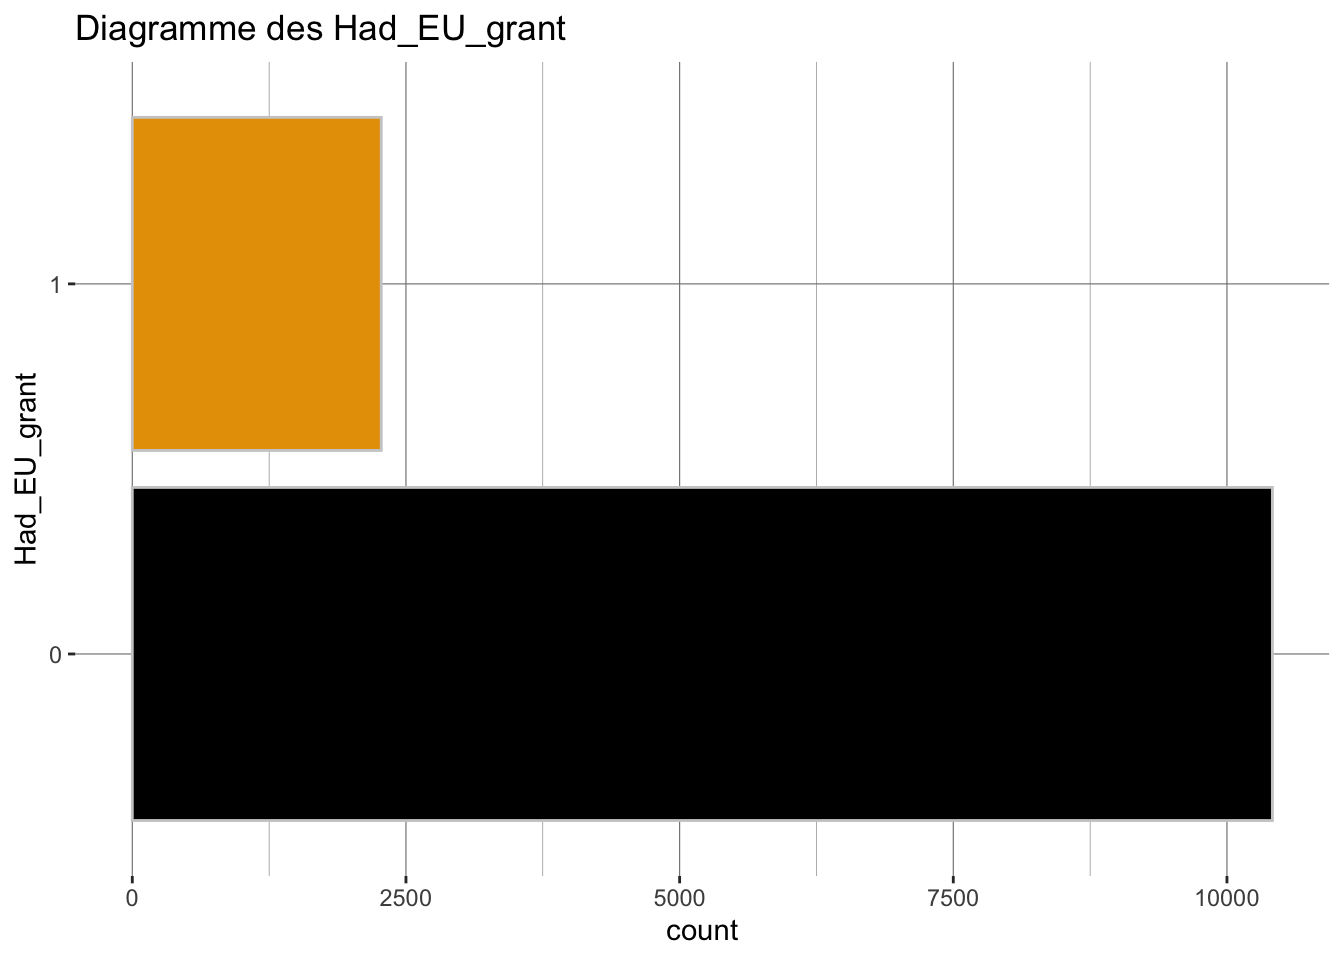
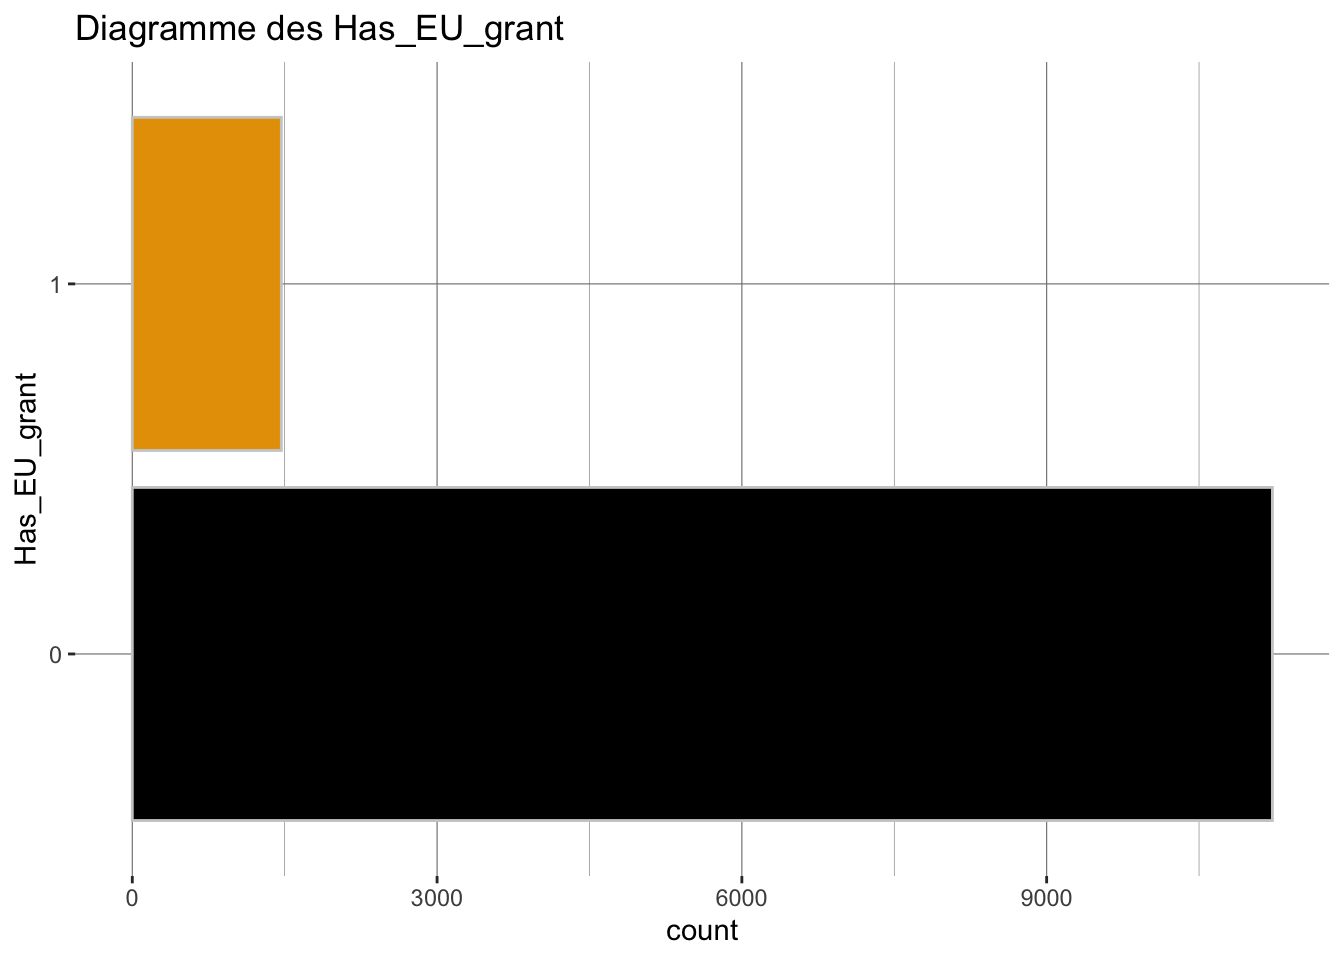
| Has_EU_grant | ||||||||||||||
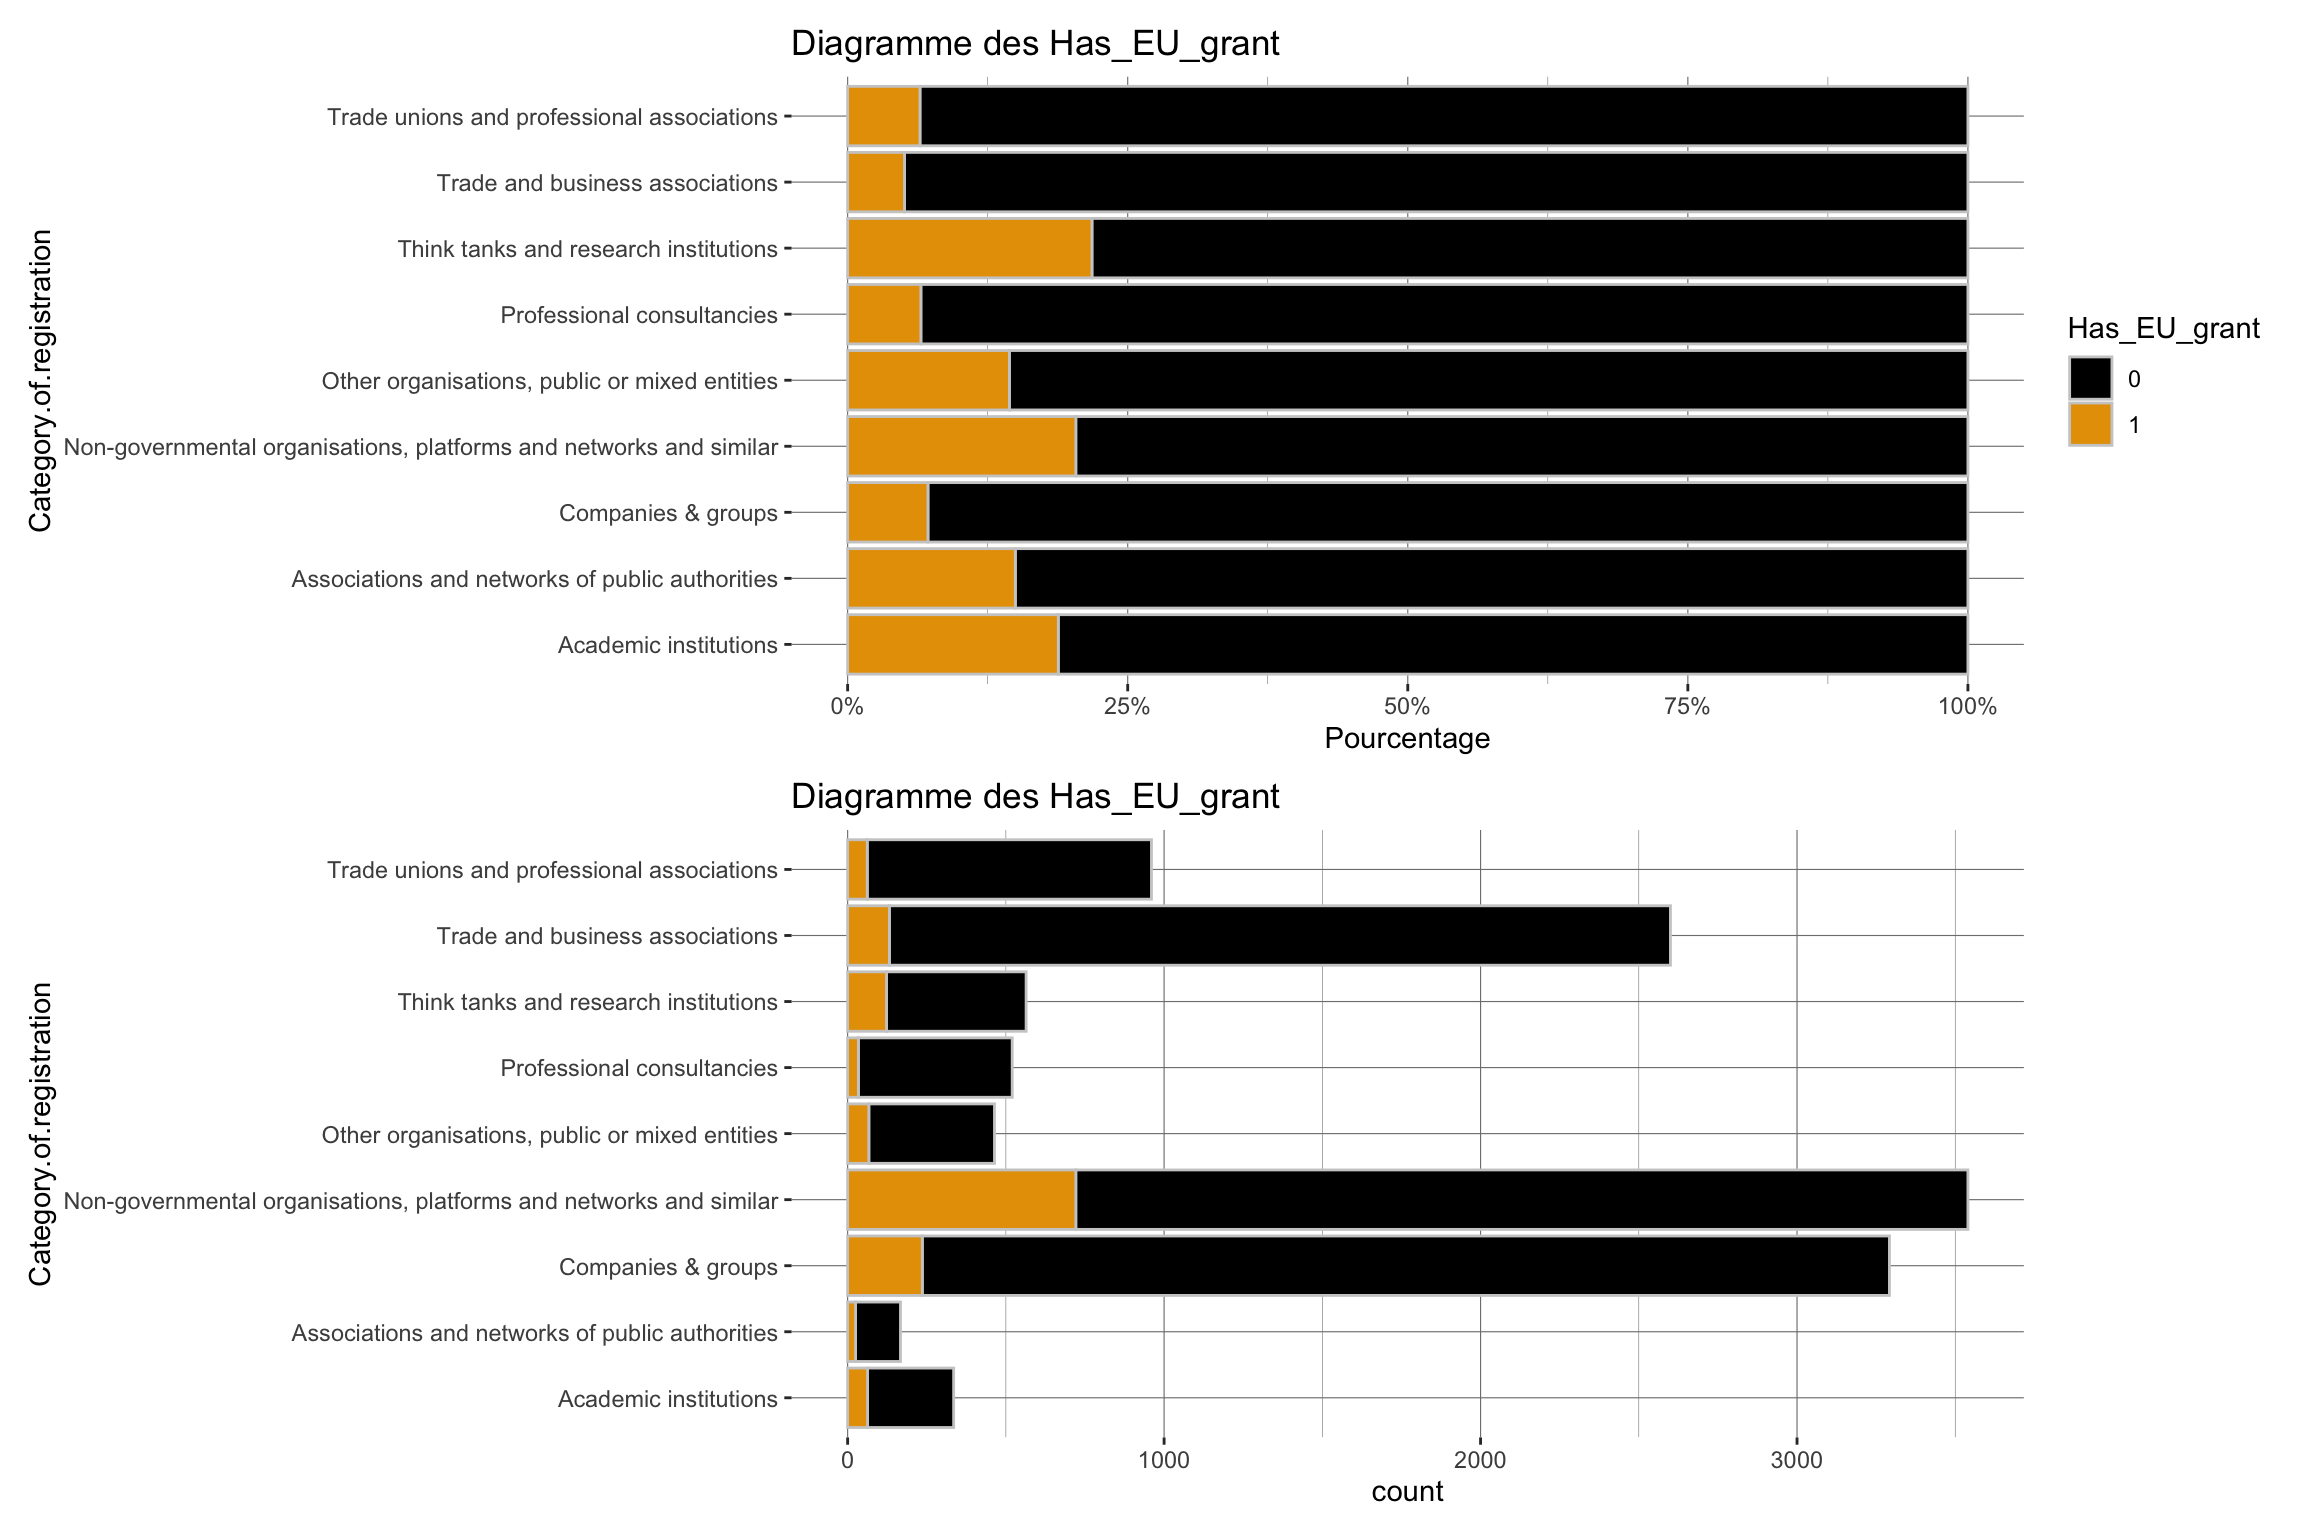
| 0 | 272 (2.4%) | 142 (1.3%) | 3,056 (27%) | 2 (<0.1%) | 69 (0.6%) | 2,819 (25%) | 43 (0.4%) | 397 (3.5%) | 486 (4.3%) | 129 (1.1%) | 441 (3.9%) | 2,468 (22%) | 898 (8.0%) | 11,222 (100%) |
| 1 | 63 (4.3%) | 25 (1.7%) | 236 (16%) | 0 (0%) | 1 (<0.1%) | 721 (49%) | 3 (0.2%) | 67 (4.6%) | 34 (2.3%) | 0 (0%) | 123 (8.4%) | 132 (9.0%) | 62 (4.2%) | 1,467 (100%) |
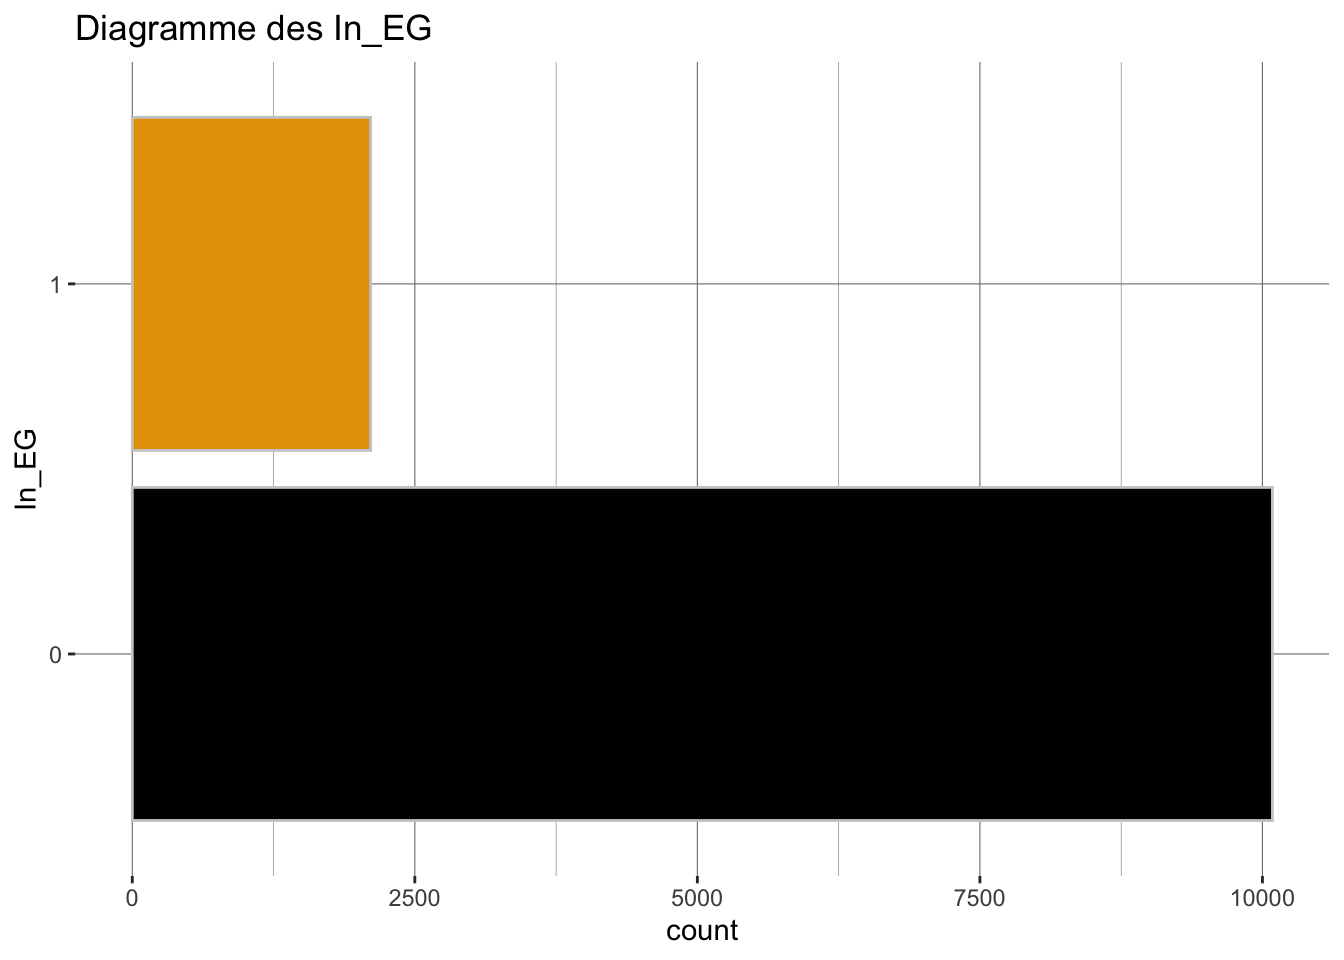
| In_EG | ||||||||||||||
| 0 | 255 (2.5%) | 131 (1.3%) | 2,727 (27%) | 1 (<0.1%) | 60 (0.6%) | 2,862 (28%) | 43 (0.4%) | 393 (3.9%) | 450 (4.5%) | 108 (1.1%) | 451 (4.5%) | 1,874 (19%) | 733 (7.3%) | 10,088 (100%) |
| 1 | 67 (3.2%) | 29 (1.4%) | 443 (21%) | 1 (<0.1%) | 6 (0.3%) | 549 (26%) | 0 (0%) | 56 (2.7%) | 13 (0.6%) | 3 (0.1%) | 90 (4.3%) | 663 (31%) | 189 (9.0%) | 2,109 (100%) |
| Unknown | 13 | 7 | 122 | 0 | 4 | 129 | 3 | 15 | 57 | 18 | 23 | 63 | 38 | 492 |
| NbExpertGroups | 0.00 (0.00, 0.00) - max = 7.00) | 0.00 (0.00, 0.00) - max = 38.00) | 0.00 (0.00, 0.00) - max = 9.00) | 1.00 (0.00, 2.00) - max = 2.00) | 0.00 (0.00, 0.00) - max = 1.00) | 0.00 (0.00, 0.00) - max = 47.00) | 0.00 (0.00, 0.00) - max = 0.00) | 0.00 (0.00, 0.00) - max = 12.00) | 0.00 (0.00, 0.00) - max = 3.00) | 0.00 (0.00, 0.00) - max = 1.00) | 0.00 (0.00, 0.00) - max = 11.00) | 0.00 (0.00, 1.00) - max = 55.00) | 0.00 (0.00, 0.00) - max = 26.00) | 0.00 (0.00, 0.00) - max = 55.00) |
| Unknown | 13 | 7 | 122 | 0 | 4 | 129 | 3 | 15 | 57 | 18 | 23 | 63 | 38 | 492 |
| LoI_.global | 116 (4.4%) | 27 (1.0%) | 772 (29%) | 0 (0%) | 20 (0.8%) | 743 (28%) | 5 (0.2%) | 80 (3.0%) | 132 (5.0%) | 26 (1.0%) | 169 (6.4%) | 395 (15%) | 151 (5.7%) | 2,636 (100%) |
| LoI_.national | 162 (4.0%) | 53 (1.3%) | 987 (24%) | 0 (0%) | 23 (0.6%) | 1,059 (26%) | 13 (0.3%) | 138 (3.4%) | 215 (5.3%) | 41 (1.0%) | 218 (5.4%) | 813 (20%) | 350 (8.6%) | 4,072 (100%) |
| LoI_.european | 145 (3.7%) | 53 (1.3%) | 1,020 (26%) | 0 (0%) | 27 (0.7%) | 1,051 (27%) | 16 (0.4%) | 133 (3.4%) | 208 (5.2%) | 35 (0.9%) | 227 (5.7%) | 724 (18%) | 327 (8.2%) | 3,966 (100%) |
| LoI_.sub-national | 148 (5.1%) | 49 (1.7%) | 756 (26%) | 0 (0%) | 12 (0.4%) | 803 (27%) | 9 (0.3%) | 114 (3.9%) | 151 (5.2%) | 28 (1.0%) | 177 (6.1%) | 433 (15%) | 242 (8.3%) | 2,922 (100%) |
| ROADMAPS | 0.00 (0.00, 0.00) - max = 10.00) | 0.00 (0.00, 1.00) - max = 13.00) | 0.00 (0.00, 0.00) - max = 57.00) | 0.00 (0.00, 0.00) - max = 0.00) | 0.00 (0.00, 0.00) - max = 2.00) | 0.00 (0.00, 1.00) - max = 93.00) | 0.00 (0.00, 0.00) - max = 9.00) | 0.00 (0.00, 0.00) - max = 111.00) | 0.00 (0.00, 0.00) - max = 21.00) | 0.00 (0.00, 0.00) - max = 2.00) | 0.00 (0.00, 0.00) - max = 24.00) | 0.00 (0.00, 2.00) - max = 94.00) | 0.00 (0.00, 1.00) - max = 36.00) | 0.00 (0.00, 1.00) - max = 111.00) |
| Unknown | 13 | 7 | 122 | 0 | 4 | 129 | 3 | 15 | 57 | 18 | 23 | 63 | 38 | 492 |
| OPC | 1.00 (0.00, 2.00) - max = 15.00) | 0.00 (0.00, 1.00) - max = 16.00) | 0.00 (0.00, 1.00) - max = 54.00) | 0.00 (0.00, 0.00) - max = 0.00) | 0.00 (0.00, 0.00) - max = 8.00) | 0.00 (0.00, 1.00) - max = 91.00) | 0.00 (0.00, 0.00) - max = 13.00) | 0.00 (0.00, 1.00) - max = 138.00) | 0.00 (0.00, 0.00) - max = 17.00) | 0.00 (0.00, 0.00) - max = 3.00) | 0.00 (0.00, 1.00) - max = 25.00) | 1.00 (0.00, 4.00) - max = 86.00) | 0.00 (0.00, 2.00) - max = 91.00) | 0.00 (0.00, 1.00) - max = 138.00) |
| Unknown | 13 | 7 | 122 | 0 | 4 | 129 | 3 | 15 | 57 | 18 | 23 | 63 | 38 | 492 |
| 1 Median (Q1, Q3) - max = 100% Centile) ; n (%) | ||||||||||||||
| Type d'organisation | |
| Dans le registre de transparence de 2024 | |
| Characteristic | N = 12,6891 |
|---|---|
| Category.of.registration | |
| Academic institutions | 335 (2.6%) |
| Associations and networks of public authorities | 167 (1.3%) |
| Companies & groups | 3,292 (26%) |
| Entities, offices or networks established by third countries | 2 (<0.1%) |
| Law firms | 70 (0.6%) |
| Non-governmental organisations, platforms and networks and similar | 3,540 (28%) |
| Organisations representing churches and religious communities | 46 (0.4%) |
| Other organisations, public or mixed entities | 464 (3.7%) |
| Professional consultancies | 520 (4.1%) |
| Self-employed individuals | 129 (1.0%) |
| Think tanks and research institutions | 564 (4.4%) |
| Trade and business associations | 2,600 (20%) |
| Trade unions and professional associations | 960 (7.6%) |
| 1 n (%) | |

   0%   10%   20%   30%   40%   50%   60%   70%   80%   90%  100%
0.10 0.10 0.25 0.40 0.50 0.95 1.10 1.60 2.50 4.00 91.50 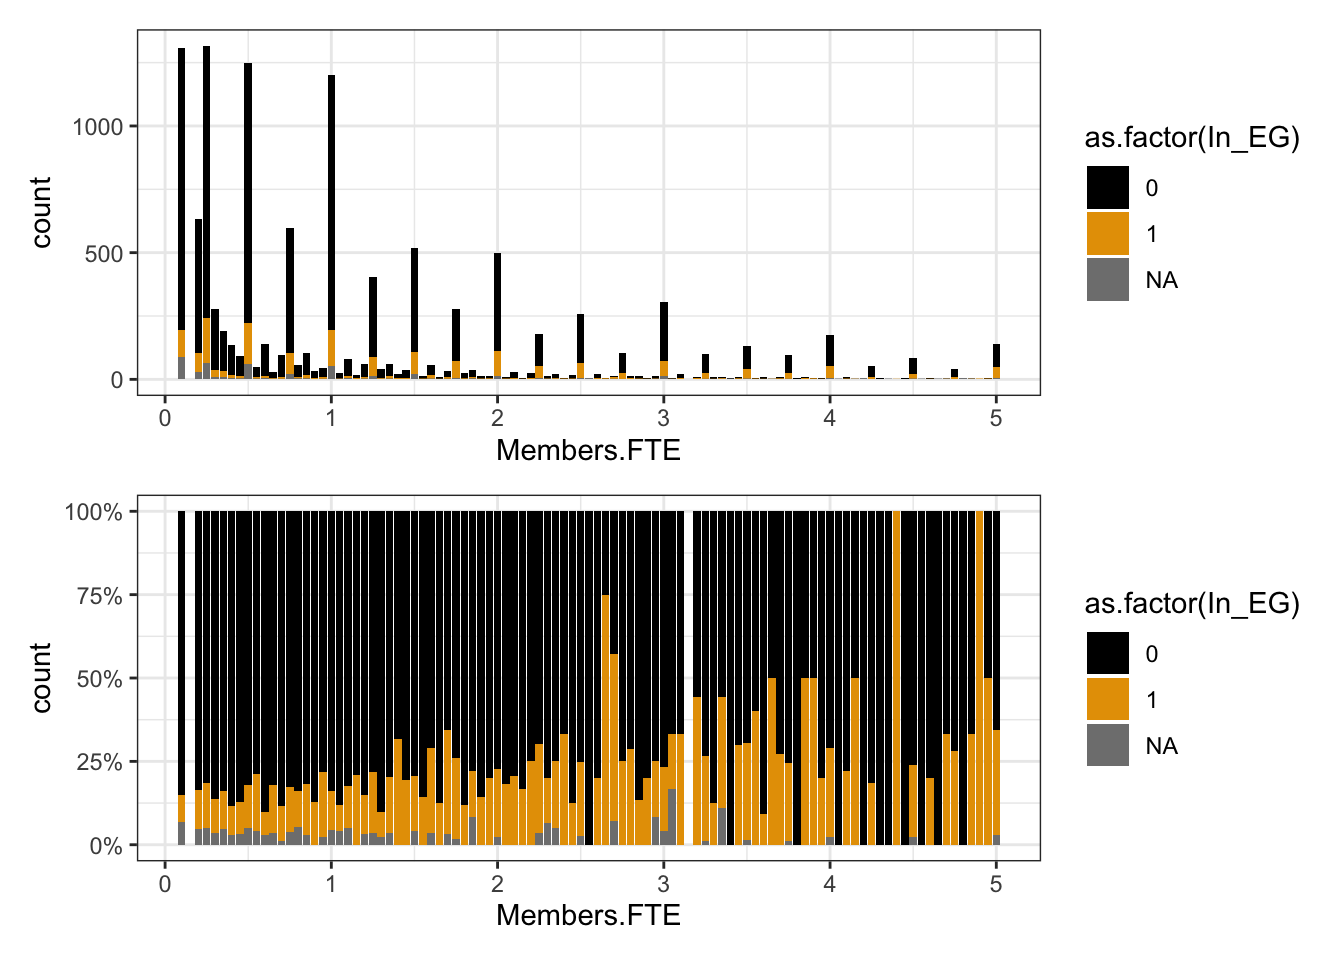
Le chargement a nécessité le package : grid (0,1] (1,2] (2,5] (5,10] (10,100]
7550 2241 2048 617 233 492 missing rows in the "In_EG" column have been removed.| Characteristic | 0 N = 10,0881 |
1 N = 2,1091 |
|---|---|---|
| FTE_RECO | ||
| (0,1] | 6,310 (63%) | 878 (42%) |
| (1,2] | 1,755 (17%) | 418 (20%) |
| (2,5] | 1,502 (15%) | 500 (24%) |
| (5,10] | 379 (3.8%) | 225 (11%) |
| (10,100] | 142 (1.4%) | 88 (4.2%) |
| 1 n (%) | ||
[1] 1.395304e-97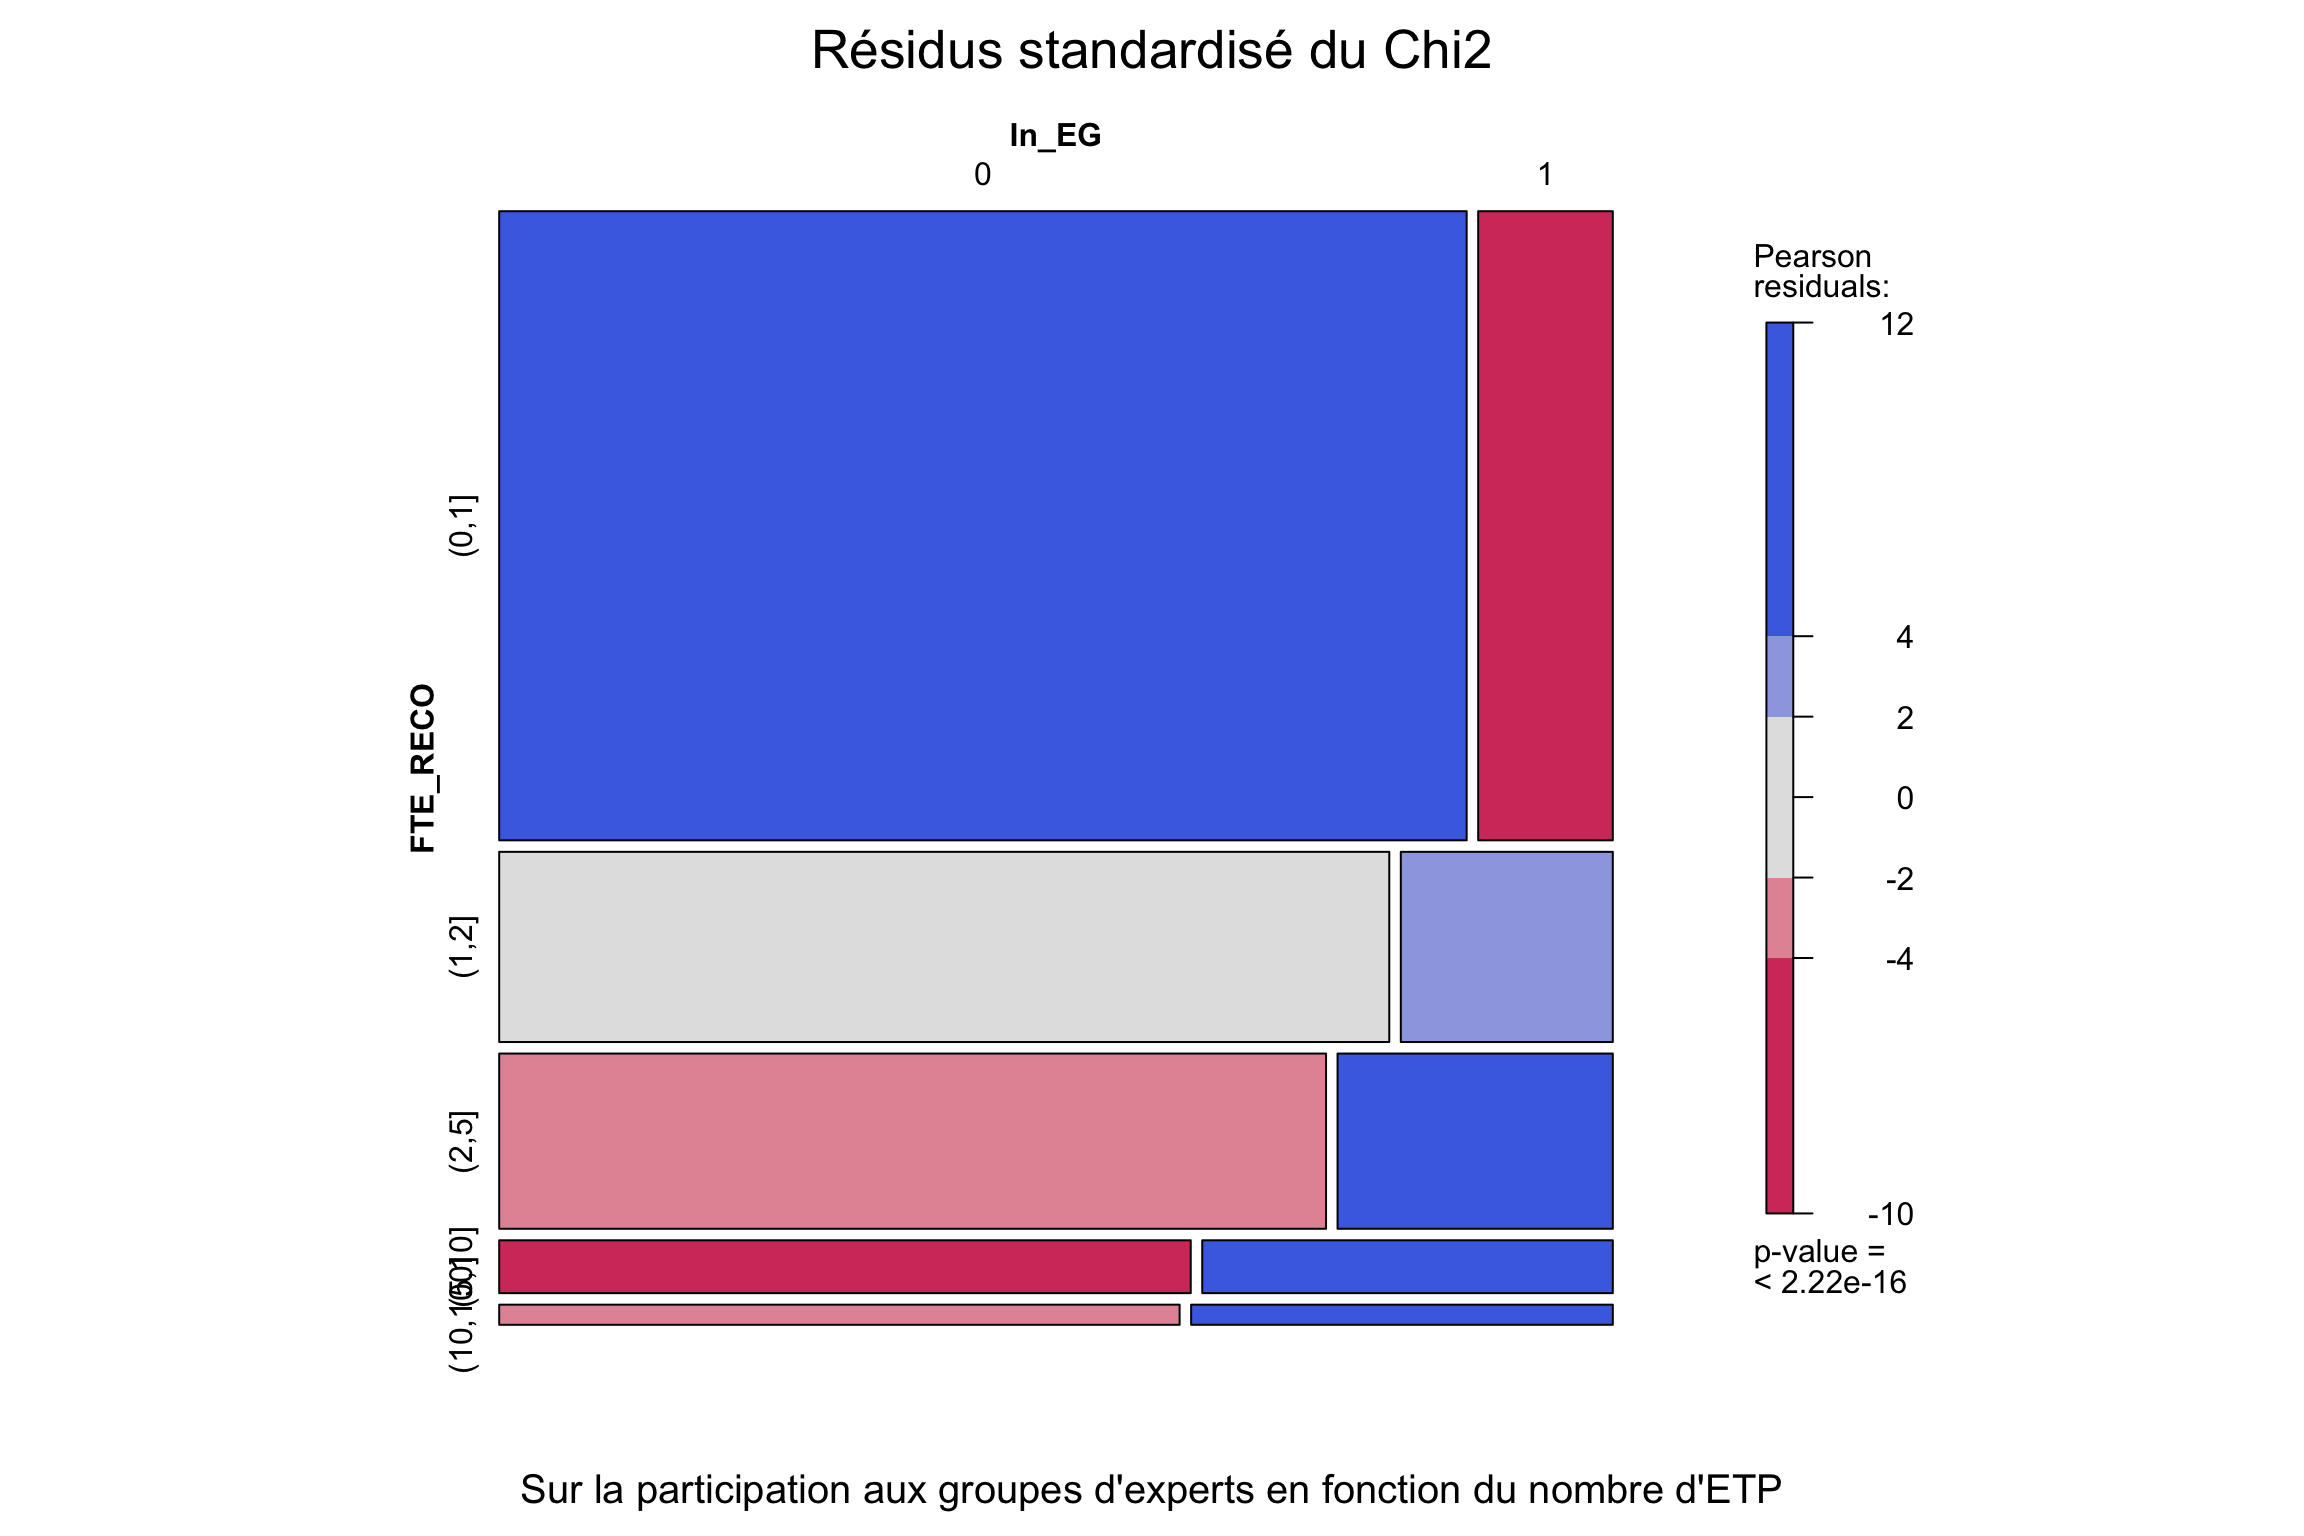
| Characteristic | N = 12,6891 |
|---|---|
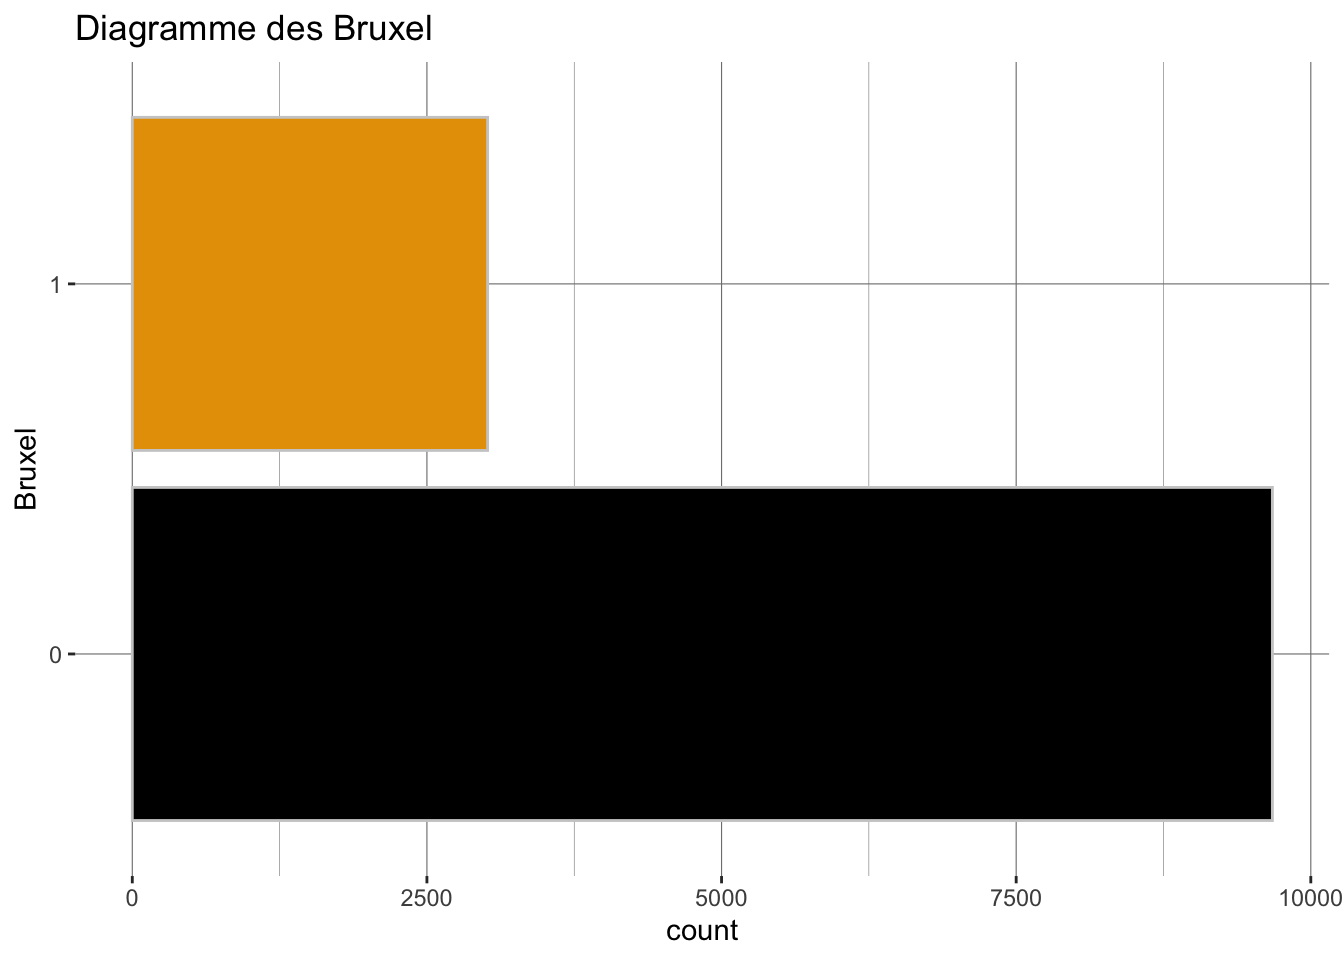
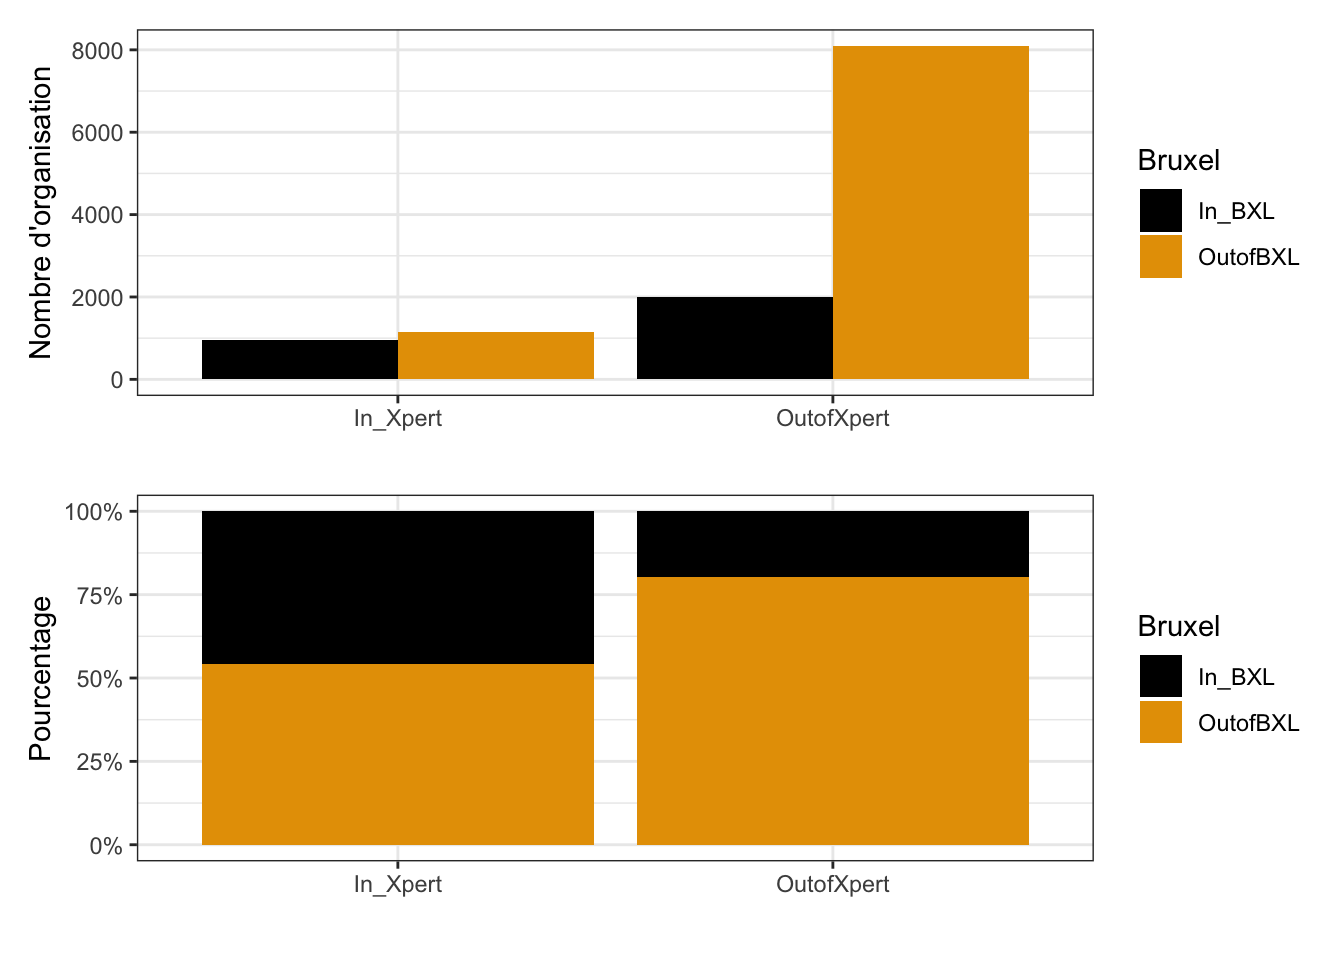
| Bruxel | |
| 0 | 9,674 (76%) |
| 1 | 3,015 (24%) |
| 1 n (%) | |
492 missing rows in the "In_EG" column have been removed.| Characteristic | 0 N = 10,0881 |
1 N = 2,1091 |
|---|---|---|
| Bruxel | ||
| 0 | 8,096 (80%) | 1,143 (54%) |
| 1 | 1,992 (20%) | 966 (46%) |
| 1 n (%) | ||
[1] 6.370983e-142 TR24Full$Bruxel
TR24Full$In_EG 0 1
0 25.39148 -25.39148
1 -25.39148 25.39148 OR 2.5 % 97.5 % p
Fisher's test 3.4345 3.1075 3.795 < 2.2e-16 ***
---
Signif. codes: 0 '***' 0.001 '**' 0.01 '*' 0.05 '.' 0.1 ' ' 1L’Odds ratio nous permet de lire que si on ne s’intéresse qu’à la participation à des groupes d’expert et à la présence de bureau à Bruxelles, on a 3,5 plus de chance de participer à un GE si l’on est à Bruxelles.
Resized limits to included dashed line in forest panel`height` was translated to `width`.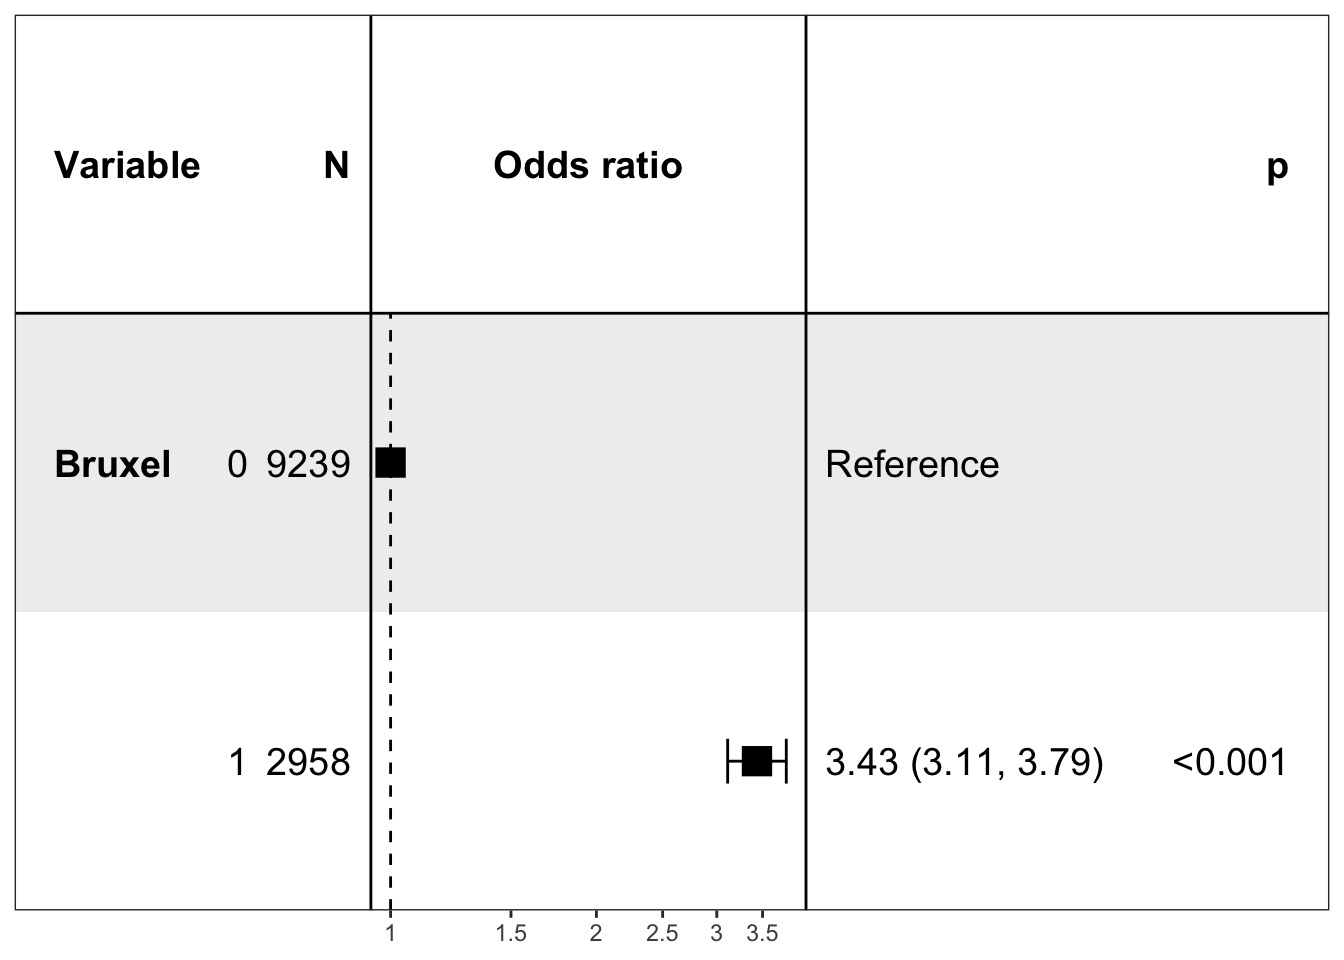
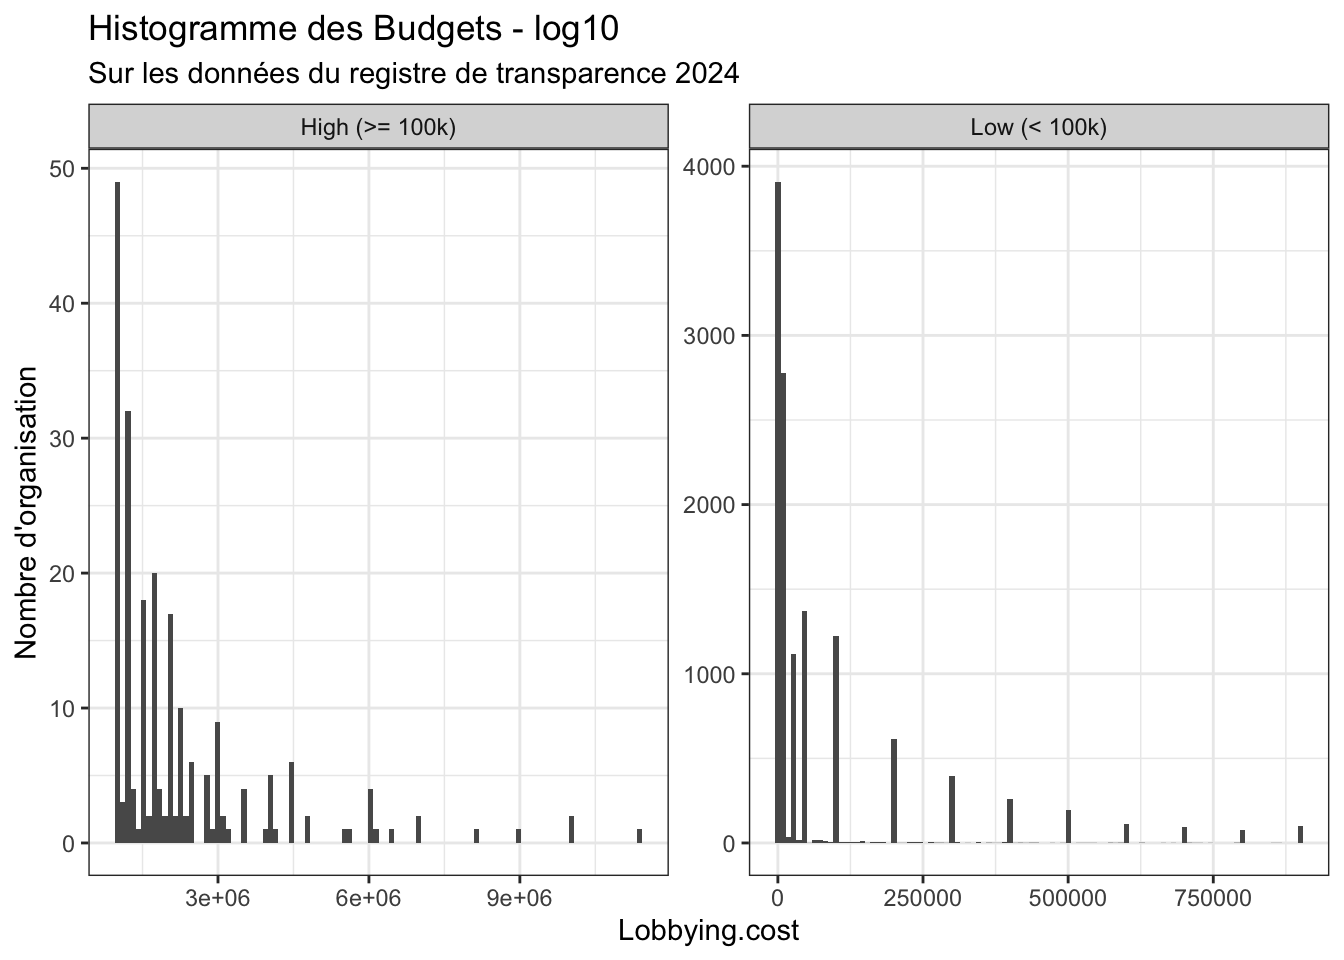
    Min.  1st Qu.   Median     Mean  3rd Qu.     Max.
       0        0    10000   119511   100000 11385000
0% 30% 40% 50% 60% 70% 80% 90%
0 0 10000 10000 25000 50000 100000 300000
100%
11385000 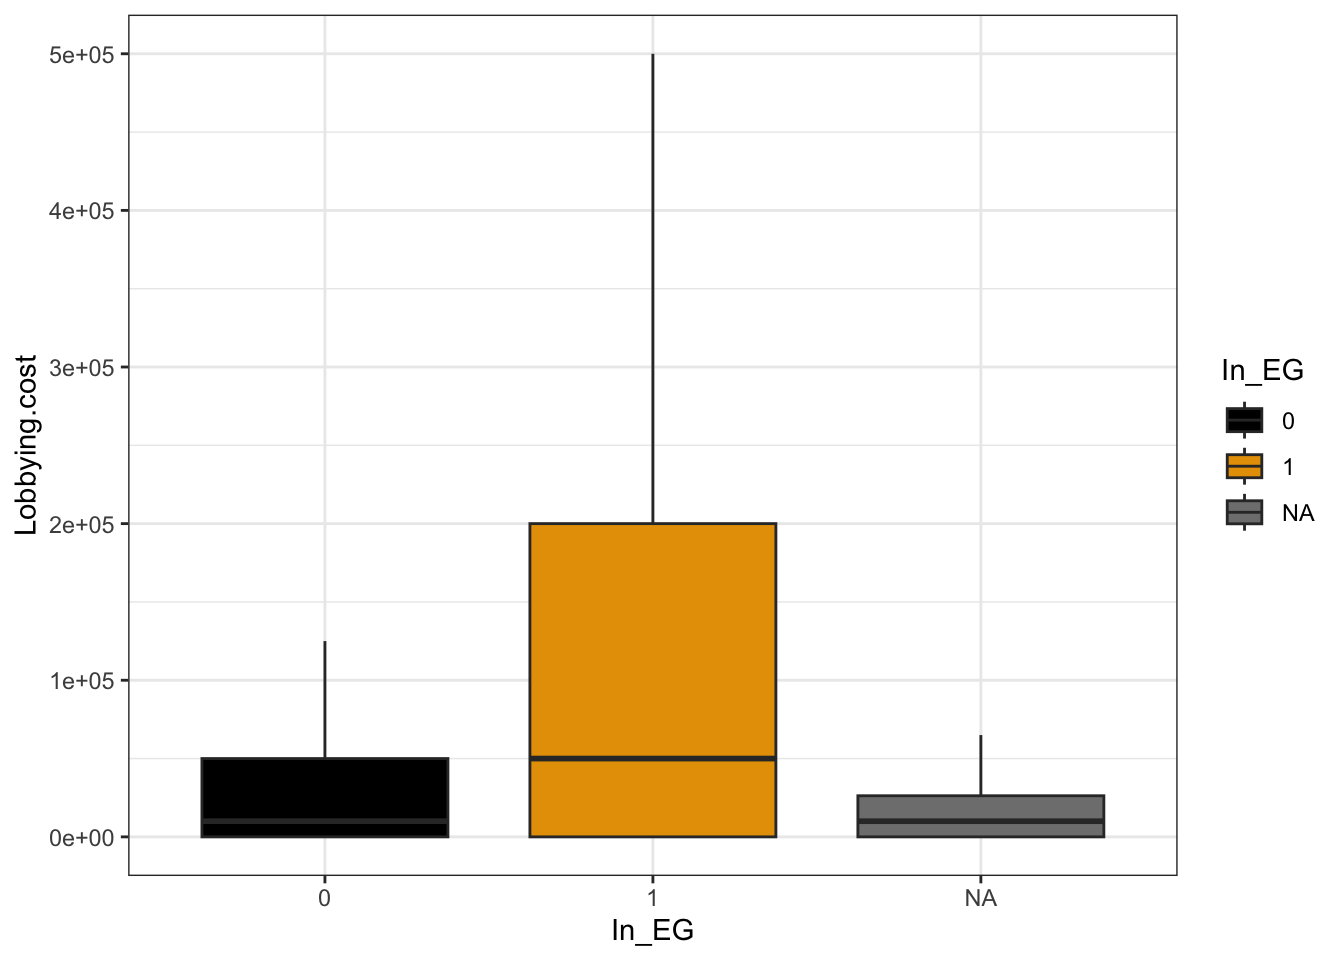
$`0`
    Min.  1st Qu.   Median     Mean  3rd Qu.     Max.
       0        0    10000    96950    50000 11385000

$`1`
    Min.  1st Qu.   Median     Mean  3rd Qu.     Max.
       0        0    50000   245652   200000 10000000
    Welch Two Sample t-test

data:  Lobbying.cost by In_EG
t = -10.44, df = 2347, p-value < 2.2e-16
alternative hypothesis: true difference in means between group 0 and group 1 is not equal to 0
95 percent confidence interval:
 -176632.9 -120771.4
sample estimates:
mean in group 0 mean in group 1
96949.84 245651.97 | Name | Lobbying.cost |
|---|---|
| Fleishman-Hillard | 11385000 |
| Veracel Celulose SA | 10000000 |
| FTI Consulting Belgium | 8180000 |
| Apple Inc. | 6500000 |
| Rud Pedersen Public Affairs Brussels | 6145000 |
| Burson Cohn & Wolfe SRL | 6080000 |
| Kreab Worldwide | 6035000 |
| Dentons Global Advisors Europe SA | 5575000 |
| EUTOP Europe GmbH | 4810000 |
| FGS Global (Europe) GmbH | 4750000 |
| Association for Financial Markets in Europe | 4500000 |
| Flint Europe | 4115000 |
| Penta (formerly Hume Brophy) | 4060000 |
| EU Focus Group | 3970000 |
| Ordem dos Solicitadores e dos Agentes de Execução | 3500000 |
| APCO Worldwide | 3185000 |
| FIPRA International SRL | 3075000 |
| Teneo Brussels | 3060000 |
| BDEW Bundesverband der Energie- und Wasserwirtschaft e. V. | 3000000 |
| British American Tobacco | 3000000 |
| Bundesverband Öffentlicher Banken Deutschlands eV | 3000000 |
| Bundesverband deutscher Banken e.V. | 3000000 |
| Servicios para una educacion alternativa A.C. | 3000000 |
| Acumen Public Affairs | 2875000 |
| Equinor ASA | 2500000 |
| Brunswick Group Limited srl | 2395000 |
| SEC NEWGATE EU | 2330000 |
| Hanover Communications International | 2310000 |
| Bundesverband der Deutschen Volksbanken und Raiffeisenbanken | 2250000 |
| Philip Morris International Inc. | 2250000 |
| Uber | 2250000 |
| The Chemours Company | 2250000 |
| McDonald’s Global Franchising Limited | 2250000 |
| Fédération Française de l'Assurance | 2250000 |
| NOVE | 2205000 |
| Hill & Knowlton International Belgium | 2180000 |
| Siemens Energy AG | 2000000 |
| International Swaps and Derivatives Association | 2000000 |
| Intel Corporation | 2000000 |
| Novartis International AG | 2000000 |
| JT International | 2000000 |
| ELECTRICITE DE FRANCE | 2000000 |
| Forward Global | 1995000 |
| Alber & Geiger | 1850000 |
| POLITICAL INTELLIGENCE BRUSSELS | 1820000 |
| Weber Shandwick | 1815000 |
| Grayling | 1790000 |
| F. Hoffmann-La Roche Ltd | 1750000 |
| Charleroi Entreprendre | 1750000 |
| ITTI Sp. z o.o. | 1750000 |
| Kontomatik Sp. z o.o. | 1750000 |
| Deutscher Sparkassen-und Giroverband | 1750000 |
| SANOFI | 1750000 |
| Finance Denmark | 1750000 |
| Associazione Bancaria Italiana | 1750000 |
| TÜV | DEKRA arge tp 21 GbR | 1700000 |
| Covington & Burling LLP | 1670000 |
| #SustainablePublicAffairs | 1655000 |
| LOW Associates Brussels | 1515000 |
| European Mortgage Federation - European Covered Bond Council | 1500000 |
| Cisco Systems Inc. | 1500000 |
| Nederlandse Vereniging van Banken / Dutch Banking Association | 1500000 |
| Syngenta Crop Protection AG | 1500000 |
| Vereniging van de Nederlandse Pluimveeverwerkende Industrie | 1500000 |
| Vodafone Belgium SA | 1500000 |
| Direction des Services de la Navigation Aérienne | 1500000 |
| European Telecommunications Standards Institute | 1500000 |
| Edelman Public Relations Worldwide | 1490000 |
| Hague Corporate Affairs | 1425000 |
| Portland PR Europe Limited | 1360000 |
| Rasmussen Global | 1350000 |
| ZN | 1345000 |
| Afore Consulting | 1310000 |
| TikTok Technology Ltd | 1250000 |
| LVMH Publica | 1250000 |
| Airbnb Ireland UC | 1250000 |
| Ingka Services A.B. | 1250000 |
| Merck Sharp & Dohme Europe Belgium SRL | 1250000 |
| France Digitale | 1250000 |
| Die Deutsche Kreditwirtschaft | 1250000 |
| Pfizer Inc. | 1250000 |
| Assicurazioni Generali S.p.A | 1250000 |
| Swedish Bankers´ Association | 1250000 |
| General Electric Company | 1250000 |
| H/Advisors Cicero | 1250000 |
| European Insurance CFO Forum | 1250000 |
| The Walt Disney Company Benelux BVBA | 1250000 |
| Daiichi Sankyo Europe GmbH | 1250000 |
| CFA Institute | 1250000 |
| Fourtold | 1180000 |
| Publyon | 1120000 |
| Trilligent | 1100000 |
| Hanbury Strategy and Communications Limited | 1095000 |
| RPP Group | 1040000 |
| ACTION EUROPE | 1040000 |
Warning: Removed 3908 rows containing non-finite outside the scale range (`stat_bin()`).
Removed 3908 rows containing non-finite outside the scale range (`stat_bin()`).
| Characteristic | N = 12,6891 |
|---|---|
| Has_EU_grant | |
| 0 | 11,222 (88%) |
| 1 | 1,467 (12%) |
| 1 n (%) | |
492 missing rows in the "In_EG" column have been removed.| Characteristic | 0 N = 10,0881 |
1 N = 2,1091 |
p-value2 |
|---|---|---|---|
| Has_EU_grant | <0.001 | ||
| 0 | 9,024 (89%) | 1,744 (83%) | |
| 1 | 1,064 (11%) | 365 (17%) | |
| 1 n (%) | |||
| 2 Pearson’s Chi-squared test | |||
                  OR  2.5 % 97.5 %         p
Fisher's test 1.7749 1.5549 2.0232 < 2.2e-16 ***
---
Signif. codes:  0 '***' 0.001 '**' 0.01 '*' 0.05 '.' 0.1 ' ' 1
Le chargement a nécessité le package : carDatalattice theme set by effectsTheme()
See ?effectsTheme for details.Resized limits to included dashed line in forest panelWarning in recalculate_width_panels(panel_positions, mapped_text = mapped_text,
: Unable to resize forest panel to be smaller than its heading; consider a
smaller text size`height` was translated to `width`.
| Nombre de rendez-vous avec la Commission | |
| Characteristic | N = 12,6891 |
|---|---|
| RECO_Meetings | |
| 0 | 7,876 (62%) |
| 1 | 1,682 (13%) |
| 2 | 701 (5.5%) |
| 3 | 441 (3.5%) |
| 4-5 | 472 (3.7%) |
| 6-10 | 527 (4.2%) |
| 11-20 | 461 (3.6%) |
| 20 et + | 529 (4.2%) |
| 1 n (%) | |
492 missing rows in the "In_EG" column have been removed.| Proportion d'organisation ayant eu un meeting par rapport à la participation à un groupe d'expert | ||
| Characteristic | In_EG N = 2,1091 |
Out_EG N = 10,0881 |
|---|---|---|
| Has_Meetings | ||
| Meeting | 1,176 (56%) | 3,531 (35%) |
| No_meeting | 933 (44%) | 6,557 (65%) |
| 1 n (%) | ||
Warning in recalculate_width_panels(panel_positions, mapped_text = mapped_text,
: Unable to resize forest panel to be smaller than its heading; consider a
smaller text size
`height` was translated to `width`.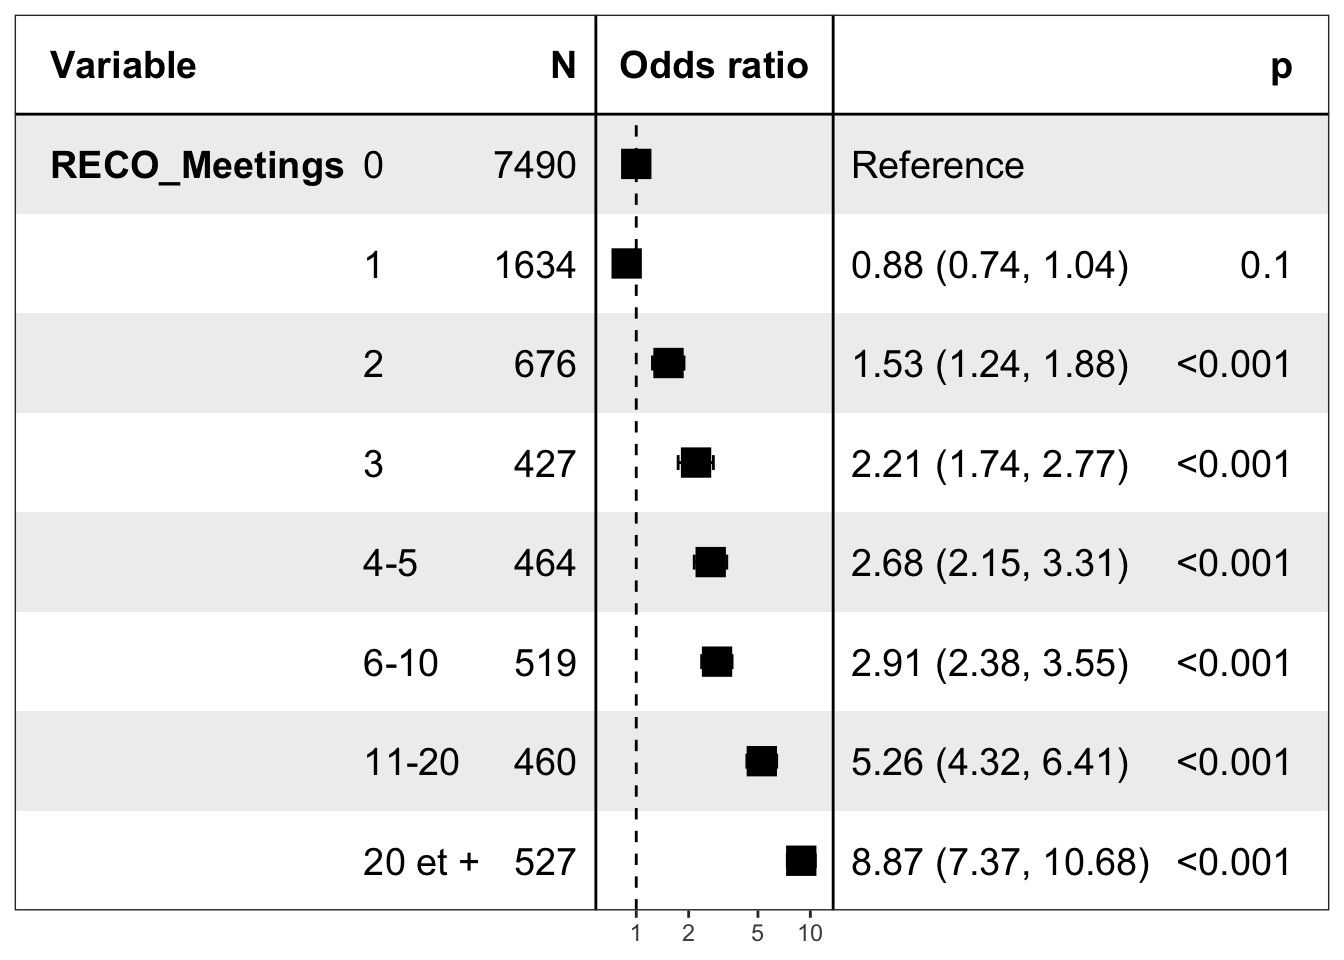
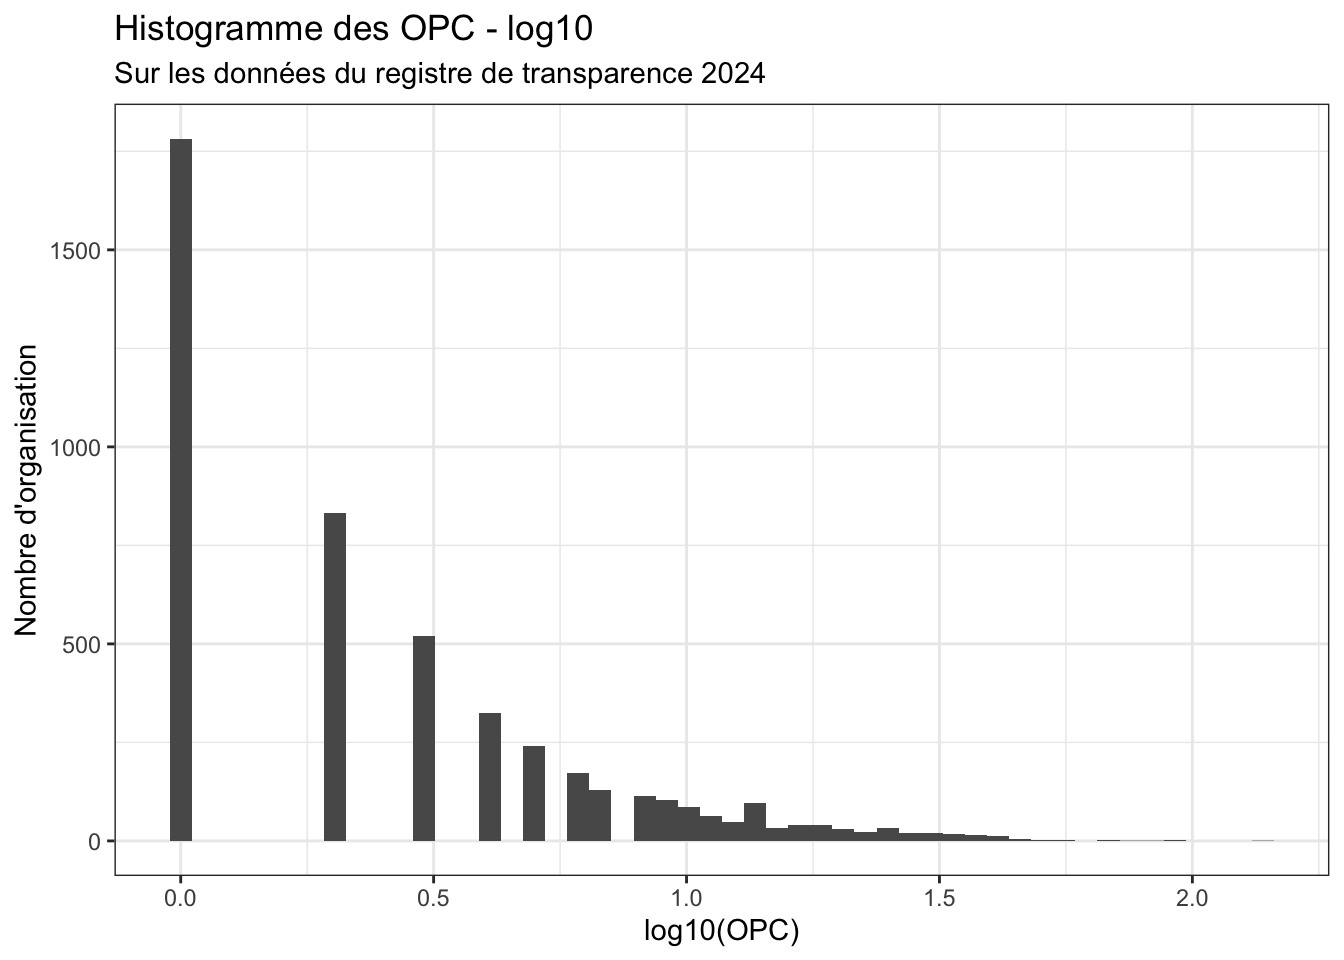
| Characteristic | N = 12,6891 |
|---|---|
| OPC | 0.00 (0.00, 1.00) |
| Unknown | 492 |
| 1 Median (Q1, Q3) | |
On supprime l’écrasante majorité de 0 pour voir ce que donne l’histogramme du reste des valeurs positives
| Characteristic | N = 12,6891 |
|---|---|
| Has_OPC | |
| No_OPC | 7,386 (61%) |
| OPC | 4,811 (39%) |
| Unknown | 492 |
| 1 n (%) | |

$`0`
   Min. 1st Qu.  Median    Mean 3rd Qu.    Max.
  0.000   0.000   0.000   1.082   1.000  57.000

$`1`
   Min. 1st Qu.  Median    Mean 3rd Qu.    Max.
  0.000   0.000   2.000   5.508   7.000 138.000
    Welch Two Sample t-test

data:  OPC by In_EG
t = -21.016, df = 2184.6, p-value < 2.2e-16
alternative hypothesis: true difference in means between group 0 and group 1 is not equal to 0
95 percent confidence interval:
 -4.839049 -4.013037
sample estimates:
mean in group 0 mean in group 1
1.081780 5.507824 | Characteristic | N = 12,6891 |
|---|---|
| ROADMAPS | 0.00 (0.00, 1.00) |
| Unknown | 492 |
| 1 Median (Q1, Q3) | |
On supprime l’écrasante majorité de 0 pour voir ce que donne l’histogramme du reste des valeurs positives
| Characteristic | N = 12,6891 |
|---|---|
| Has_RD | |
| No_OPC | 8,793 (72%) |
| OPC | 3,404 (28%) |
| Unknown | 492 |
| 1 n (%) | |


492 missing rows in the "In_EG" column have been removed.| Characteristic | 0 N = 10,0881 |
1 N = 2,1091 |
|---|---|---|
| Has_RD | ||
| No_OPC | 7,810 (77%) | 983 (47%) |
| OPC | 2,278 (23%) | 1,126 (53%) |
| 1 n (%) | ||
$`0`
   Min. 1st Qu.  Median    Mean 3rd Qu.    Max.
  0.000   0.000   0.000   0.679   0.000  72.000

$`1`
   Min. 1st Qu.  Median    Mean 3rd Qu.    Max.
  0.000   0.000   1.000   4.367   5.000 111.000
    Welch Two Sample t-test

data:  ROADMAPS by In_EG
t = -18.782, df = 2172, p-value < 2.2e-16
alternative hypothesis: true difference in means between group 0 and group 1 is not equal to 0
95 percent confidence interval:
 -4.073564 -3.303332
sample estimates:
mean in group 0 mean in group 1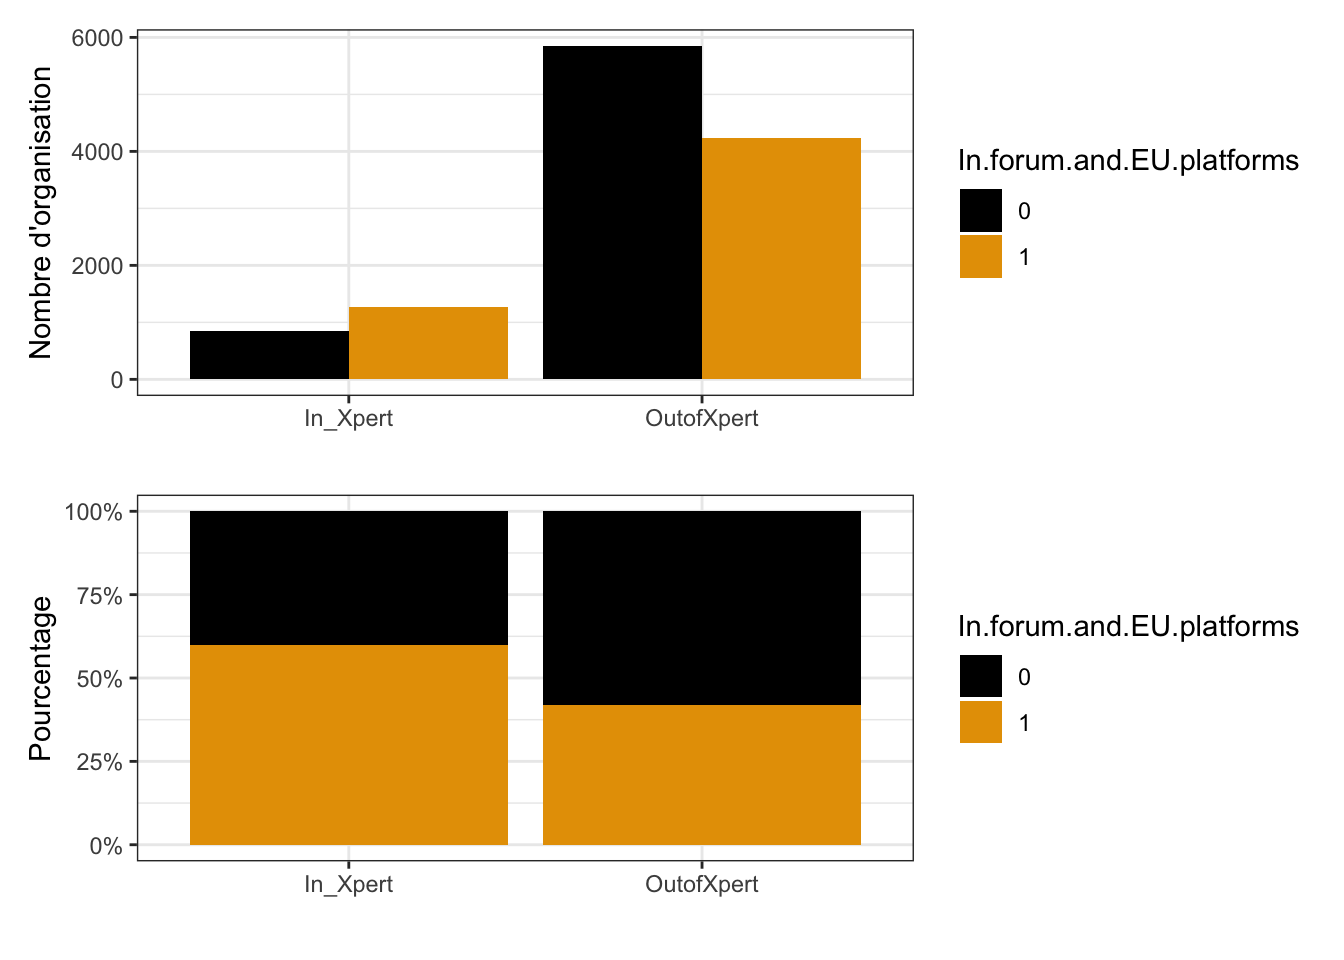
0.6790246 4.3674727 | Characteristic | N = 12,6891 |
|---|---|
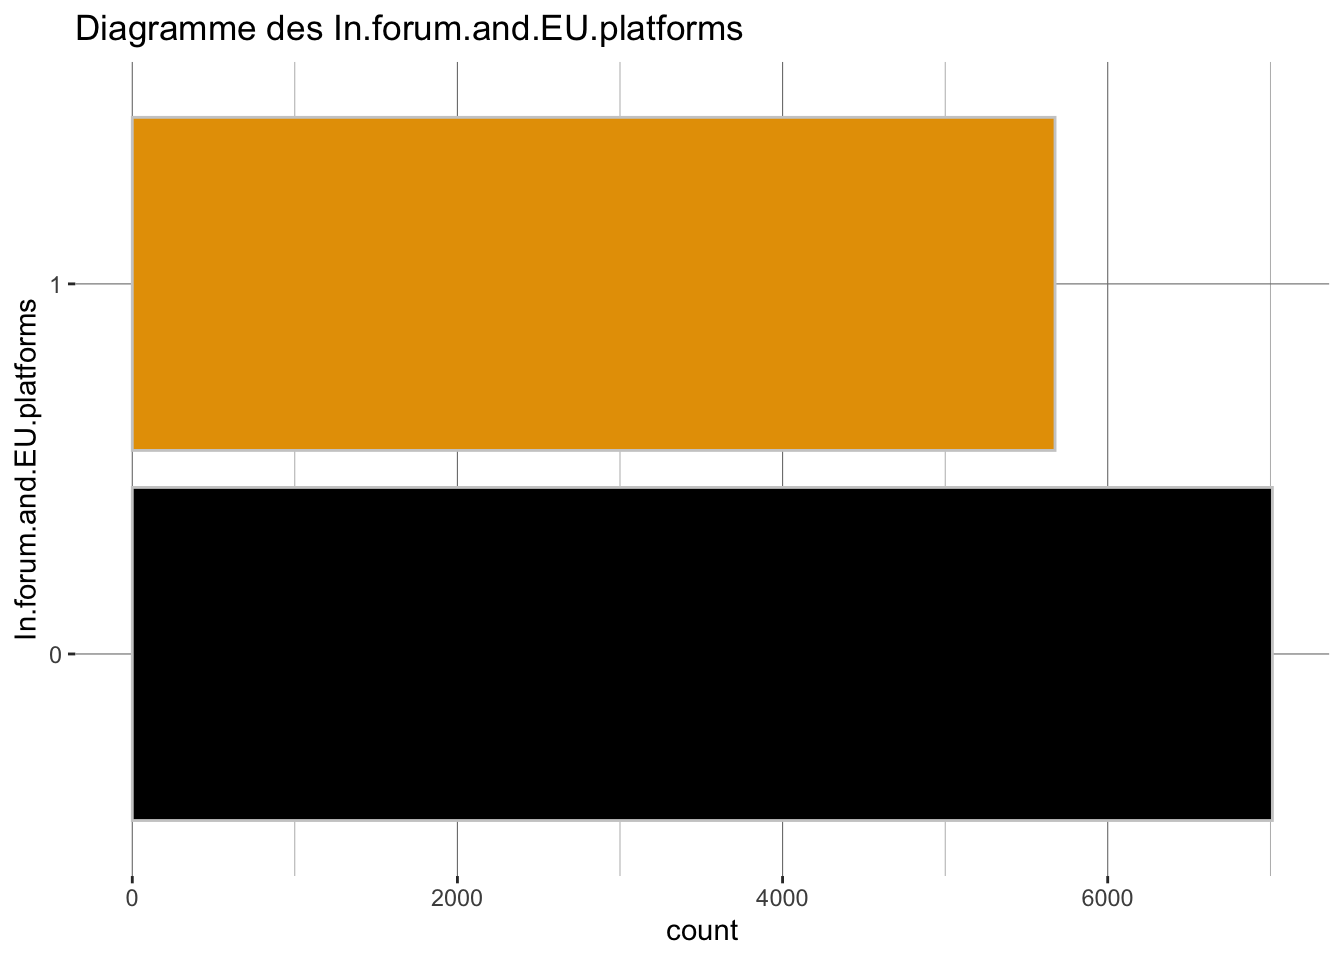
| In.forum.and.EU.platforms | |
| 0 | 7,013 (55%) |
| 1 | 5,676 (45%) |
| 1 n (%) | |
492 missing rows in the "In_EG" column have been removed.| Characteristic | 0 N = 10,0881 |
1 N = 2,1091 |
|---|---|---|
| In.forum.and.EU.platforms | ||
| 0 | 5,851 (58%) | 844 (40%) |
| 1 | 4,237 (42%) | 1,265 (60%) |
| 1 n (%) | ||
[1] 2.6457e-51
TR24Full$In_EG         0         1
             0  15.09165 -15.09165
             1 -15.09165  15.09165
OR 2.5 % 97.5 % p
Fisher's test 2.0697 1.8789 2.2805 < 2.2e-16 ***
---
Signif. codes: 0 '***' 0.001 '**' 0.01 '*' 0.05 '.' 0.1 ' ' 1Resized limits to included dashed line in forest panelWarning in recalculate_width_panels(panel_positions, mapped_text = mapped_text,
: Unable to resize forest panel to be smaller than its heading; consider a
smaller text size`height` was translated to `width`.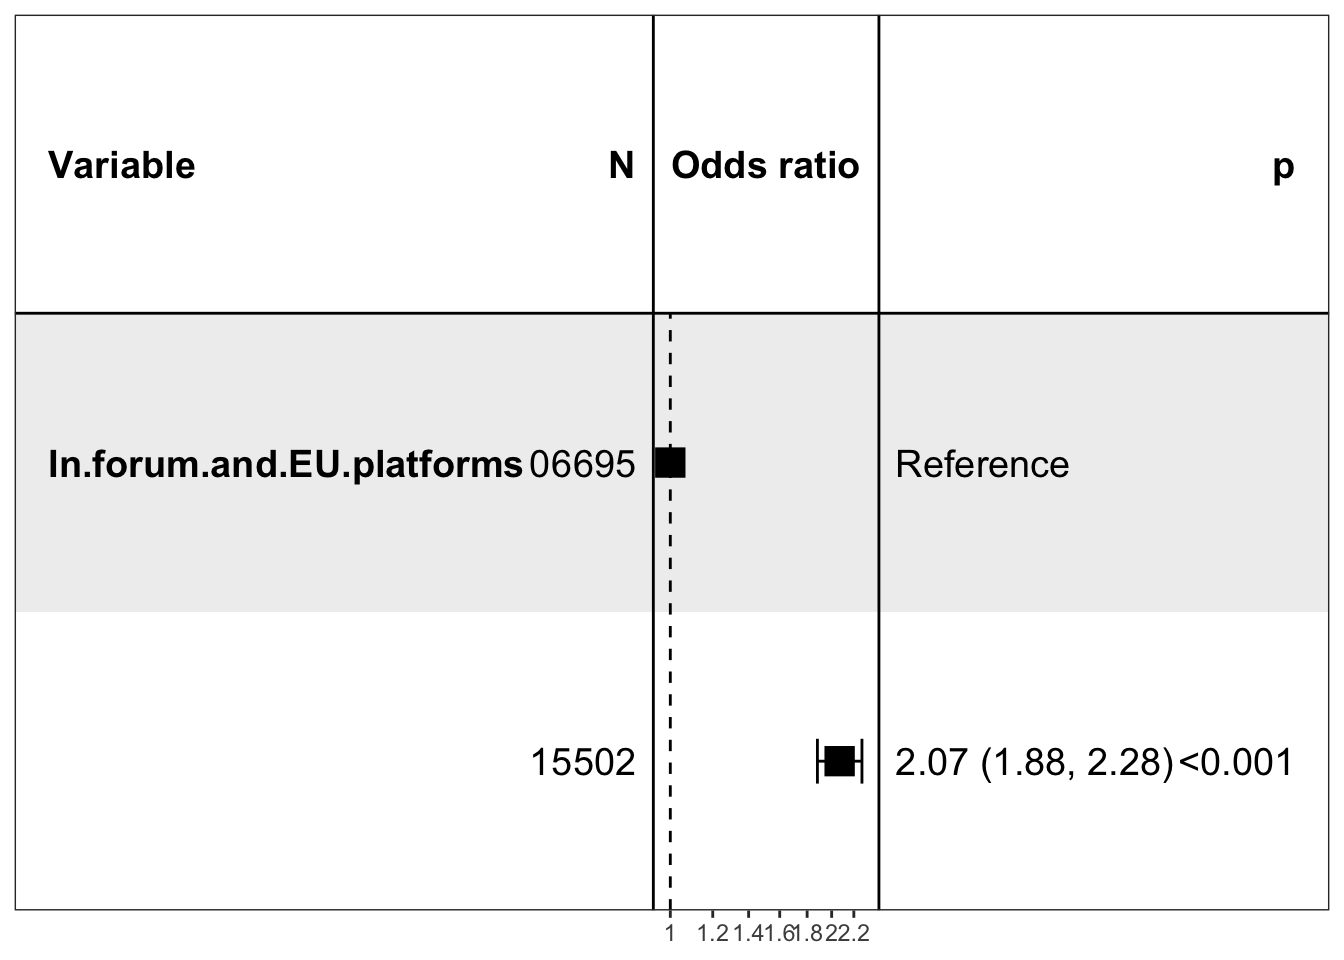
| Characteristic | N = 12,6891 |
|---|---|
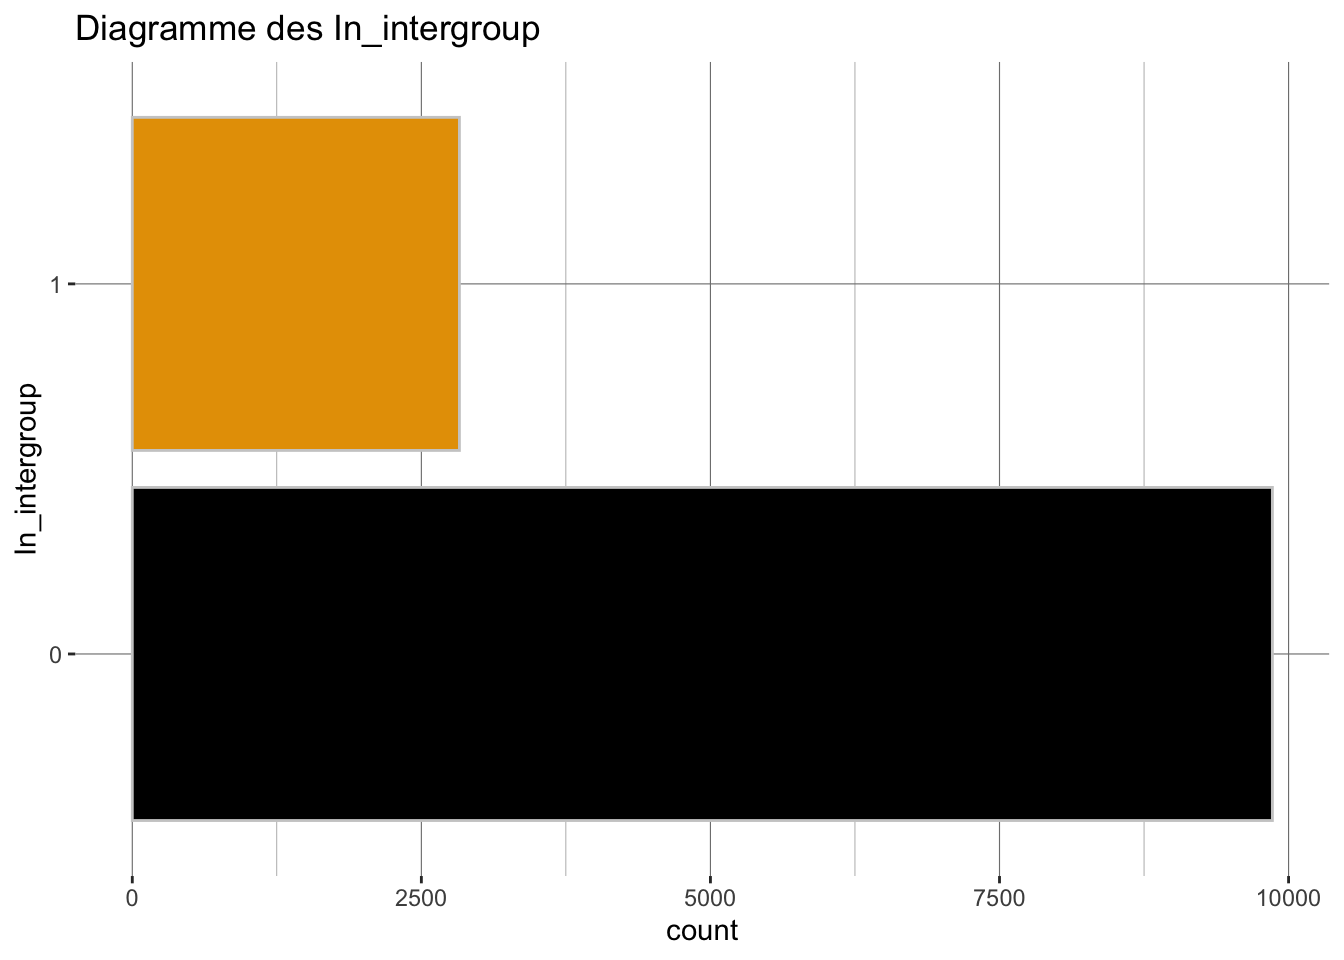
| In_intergroup | |
| 0 | 9,860 (78%) |
| 1 | 2,829 (22%) |
| 1 n (%) | |
492 missing rows in the "In_EG" column have been removed.| Characteristic | 0 N = 10,0881 |
1 N = 2,1091 |
|---|---|---|
| In_intergroup | ||
| 0 | 7,962 (79%) | 1,520 (72%) |
| 1 | 2,126 (21%) | 589 (28%) |
| 1 n (%) | ||
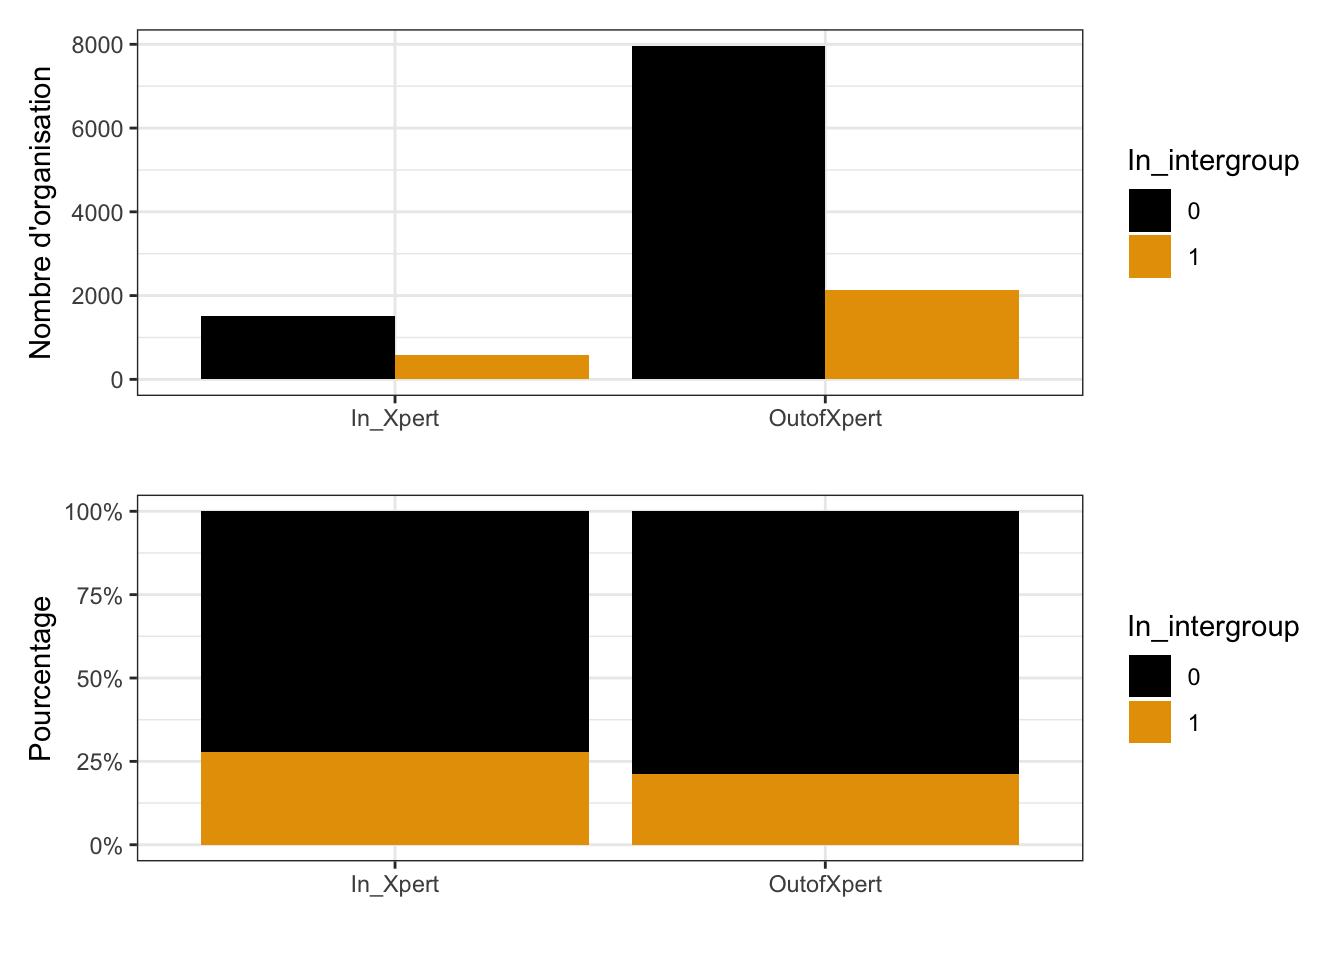
[1] 7.282532e-12 TR24Full$In_intergroup
TR24Full$In_EG 0 1
0 6.880777 -6.880777
1 -6.880777 6.880777 OR 2.5 % 97.5 % p
Fisher's test 1.4512 1.3022 1.6159 1.826e-11 ***
---
Signif. codes: 0 '***' 0.001 '**' 0.01 '*' 0.05 '.' 0.1 ' ' 1Resized limits to included dashed line in forest panel
`height` was translated to `width`.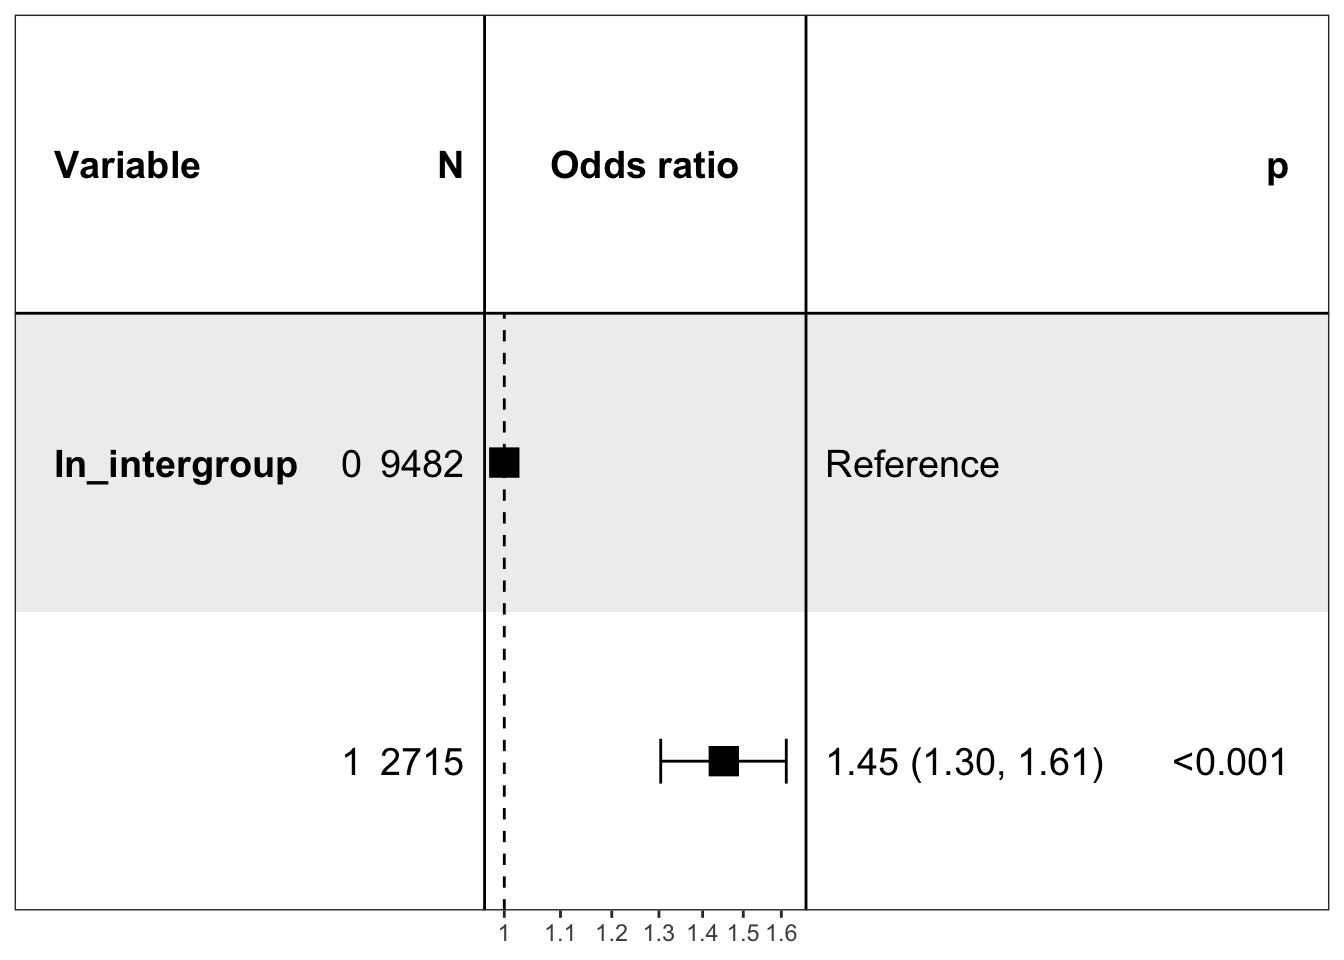
492 missing rows in the "In_EG" column have been removed.| Type d'organisation | ||
| Dans le registre de transparence de 2024 | ||
| Characteristic | 0 N = 10,0881 |
1 N = 2,1091 |
|---|---|---|
| Category.of.registration | ||
| Academic institutions | 255 (2.5%) | 67 (3.2%) |
| Associations and networks of public authorities | 131 (1.3%) | 29 (1.4%) |
| Companies & groups | 2,727 (27%) | 443 (21%) |
| Entities, offices or networks established by third countries | 1 (<0.1%) | 1 (<0.1%) |
| Law firms | 60 (0.6%) | 6 (0.3%) |
| Non-governmental organisations, platforms and networks and similar | 2,862 (28%) | 549 (26%) |
| Organisations representing churches and religious communities | 43 (0.4%) | 0 (0%) |
| Other organisations, public or mixed entities | 393 (3.9%) | 56 (2.7%) |
| Professional consultancies | 450 (4.5%) | 13 (0.6%) |
| Self-employed individuals | 108 (1.1%) | 3 (0.1%) |
| Think tanks and research institutions | 451 (4.5%) | 90 (4.3%) |
| Trade and business associations | 1,874 (19%) | 663 (31%) |
| Trade unions and professional associations | 733 (7.3%) | 189 (9.0%) |
| 1 n (%) | ||
On ne garde pas des analyses suivantes les organisations suivantes :
“Entities, offices or networks established by third countries”
“Self-employed individuals”
“Organisations representing churches and religious communities”
“Law firms”
Parce qu’elles représentent trop peu d’individus, en particulier dans les groupes experts.
`stat_bin()` using `bins = 30`. Pick better value `binwidth`.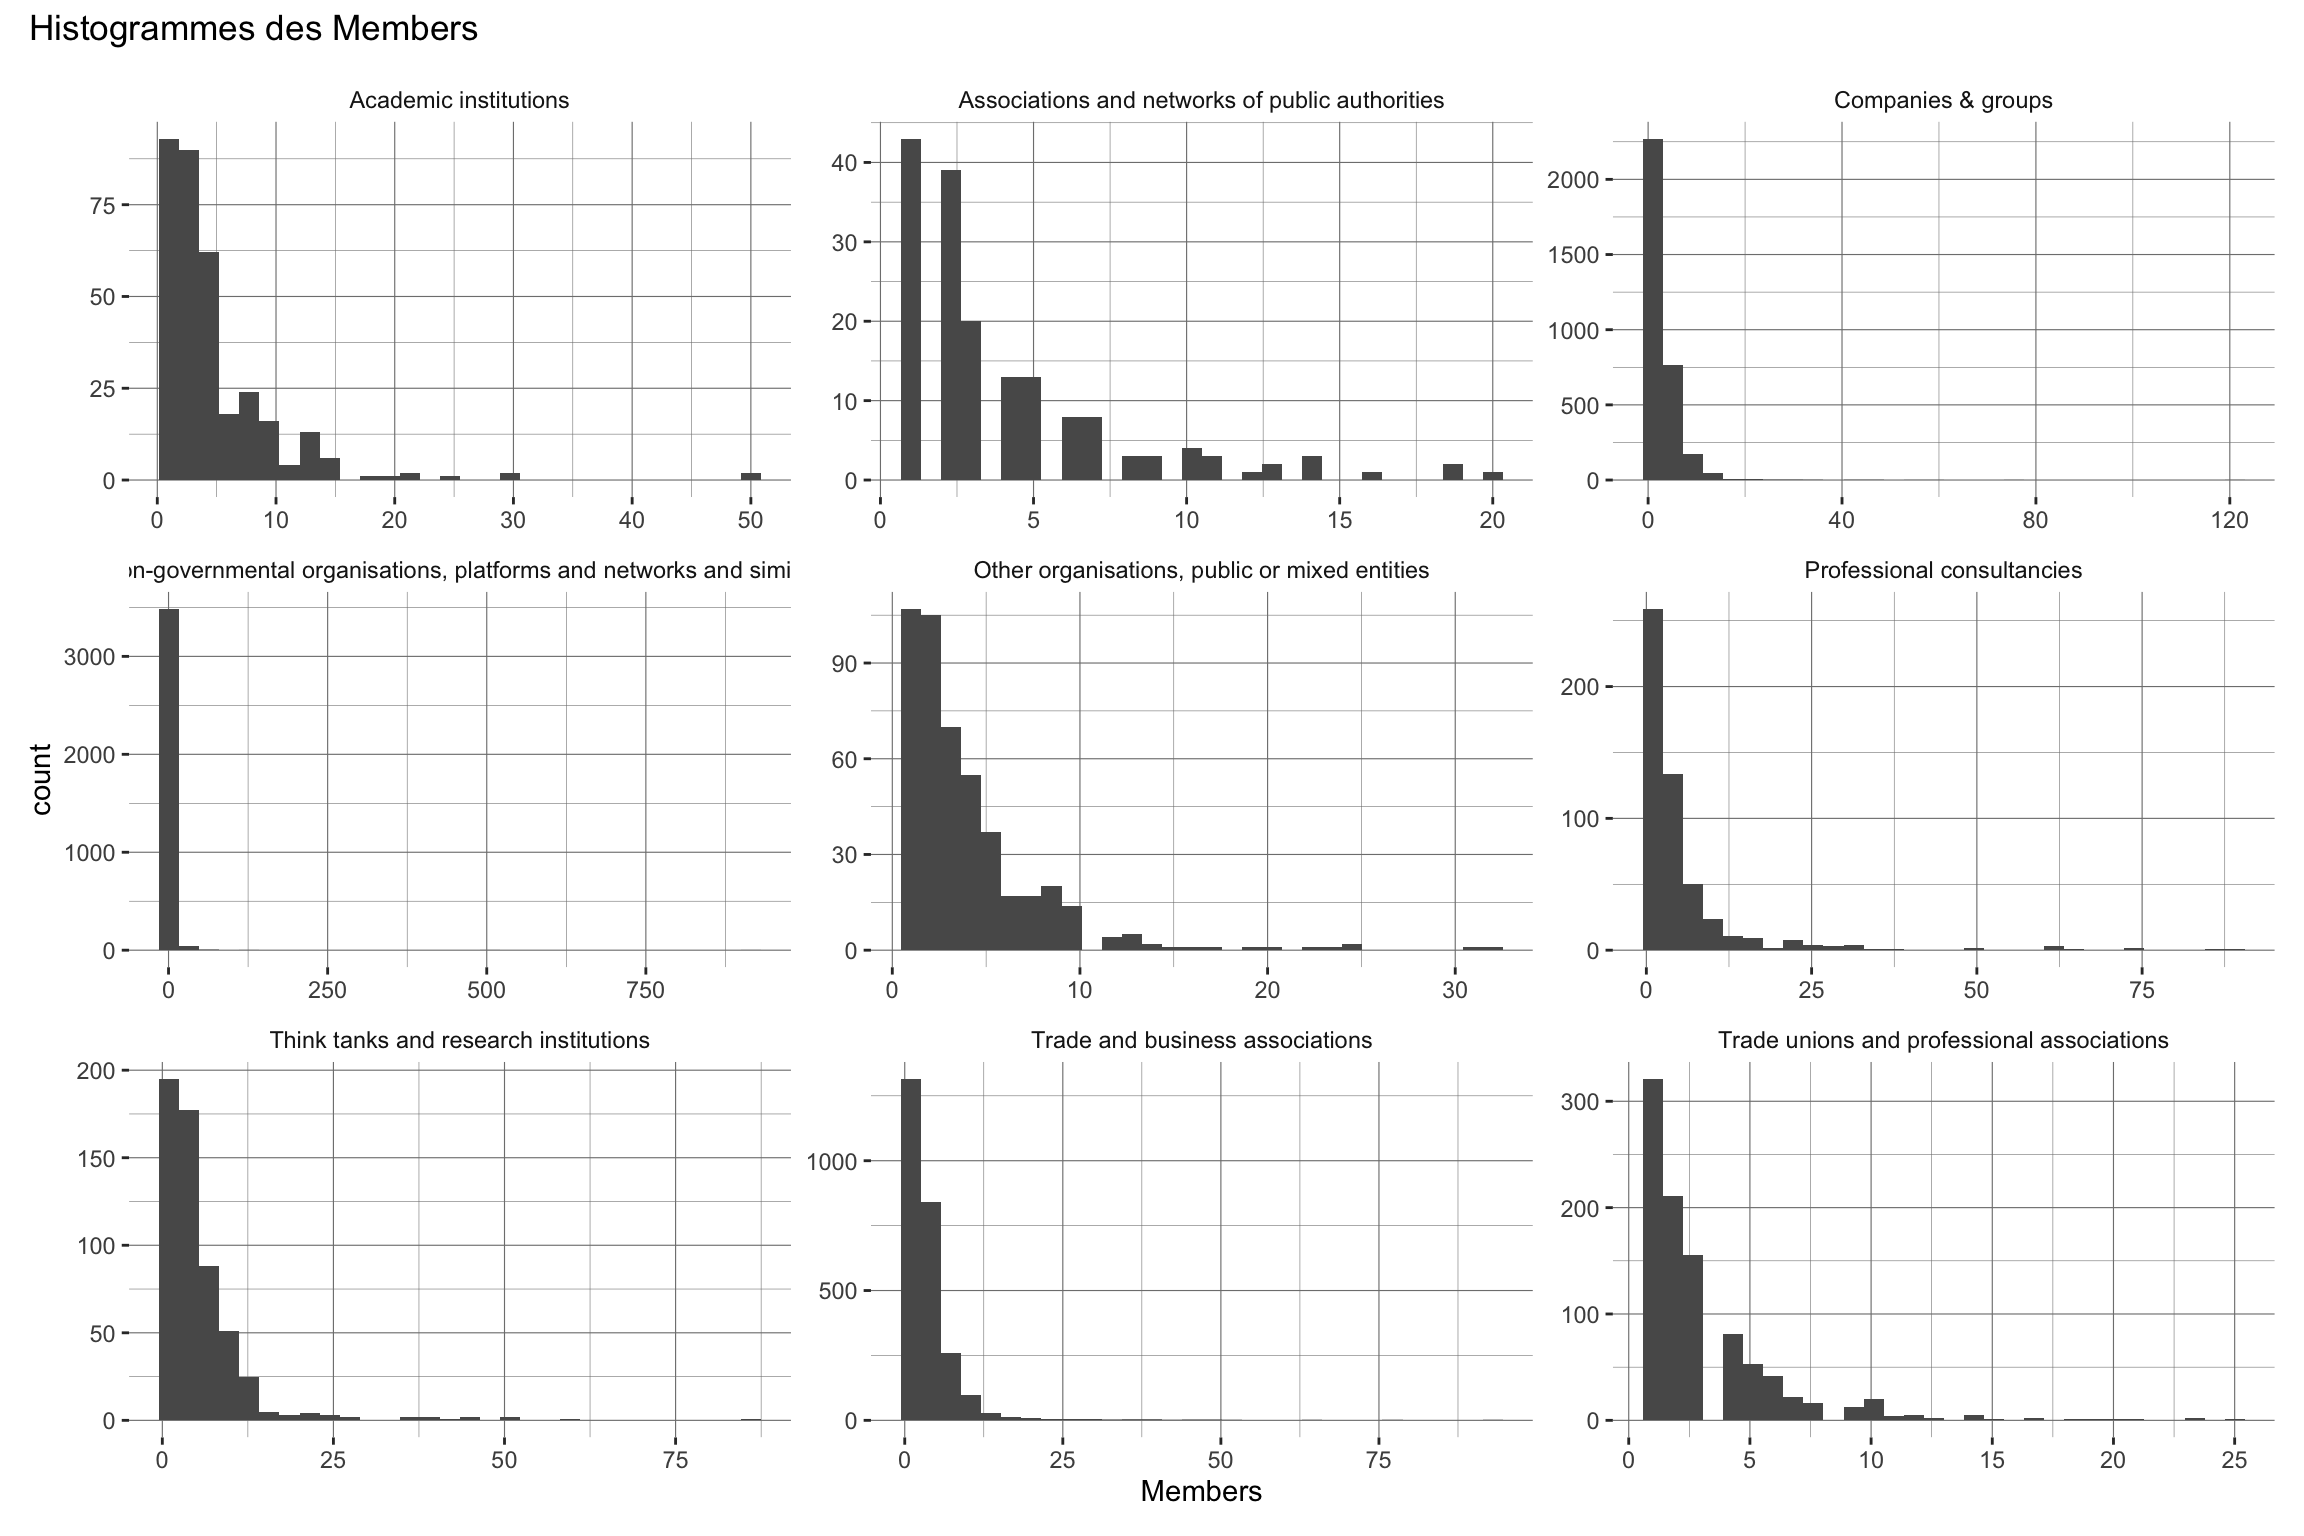
`stat_bin()` using `bins = 30`. Pick better value `binwidth`.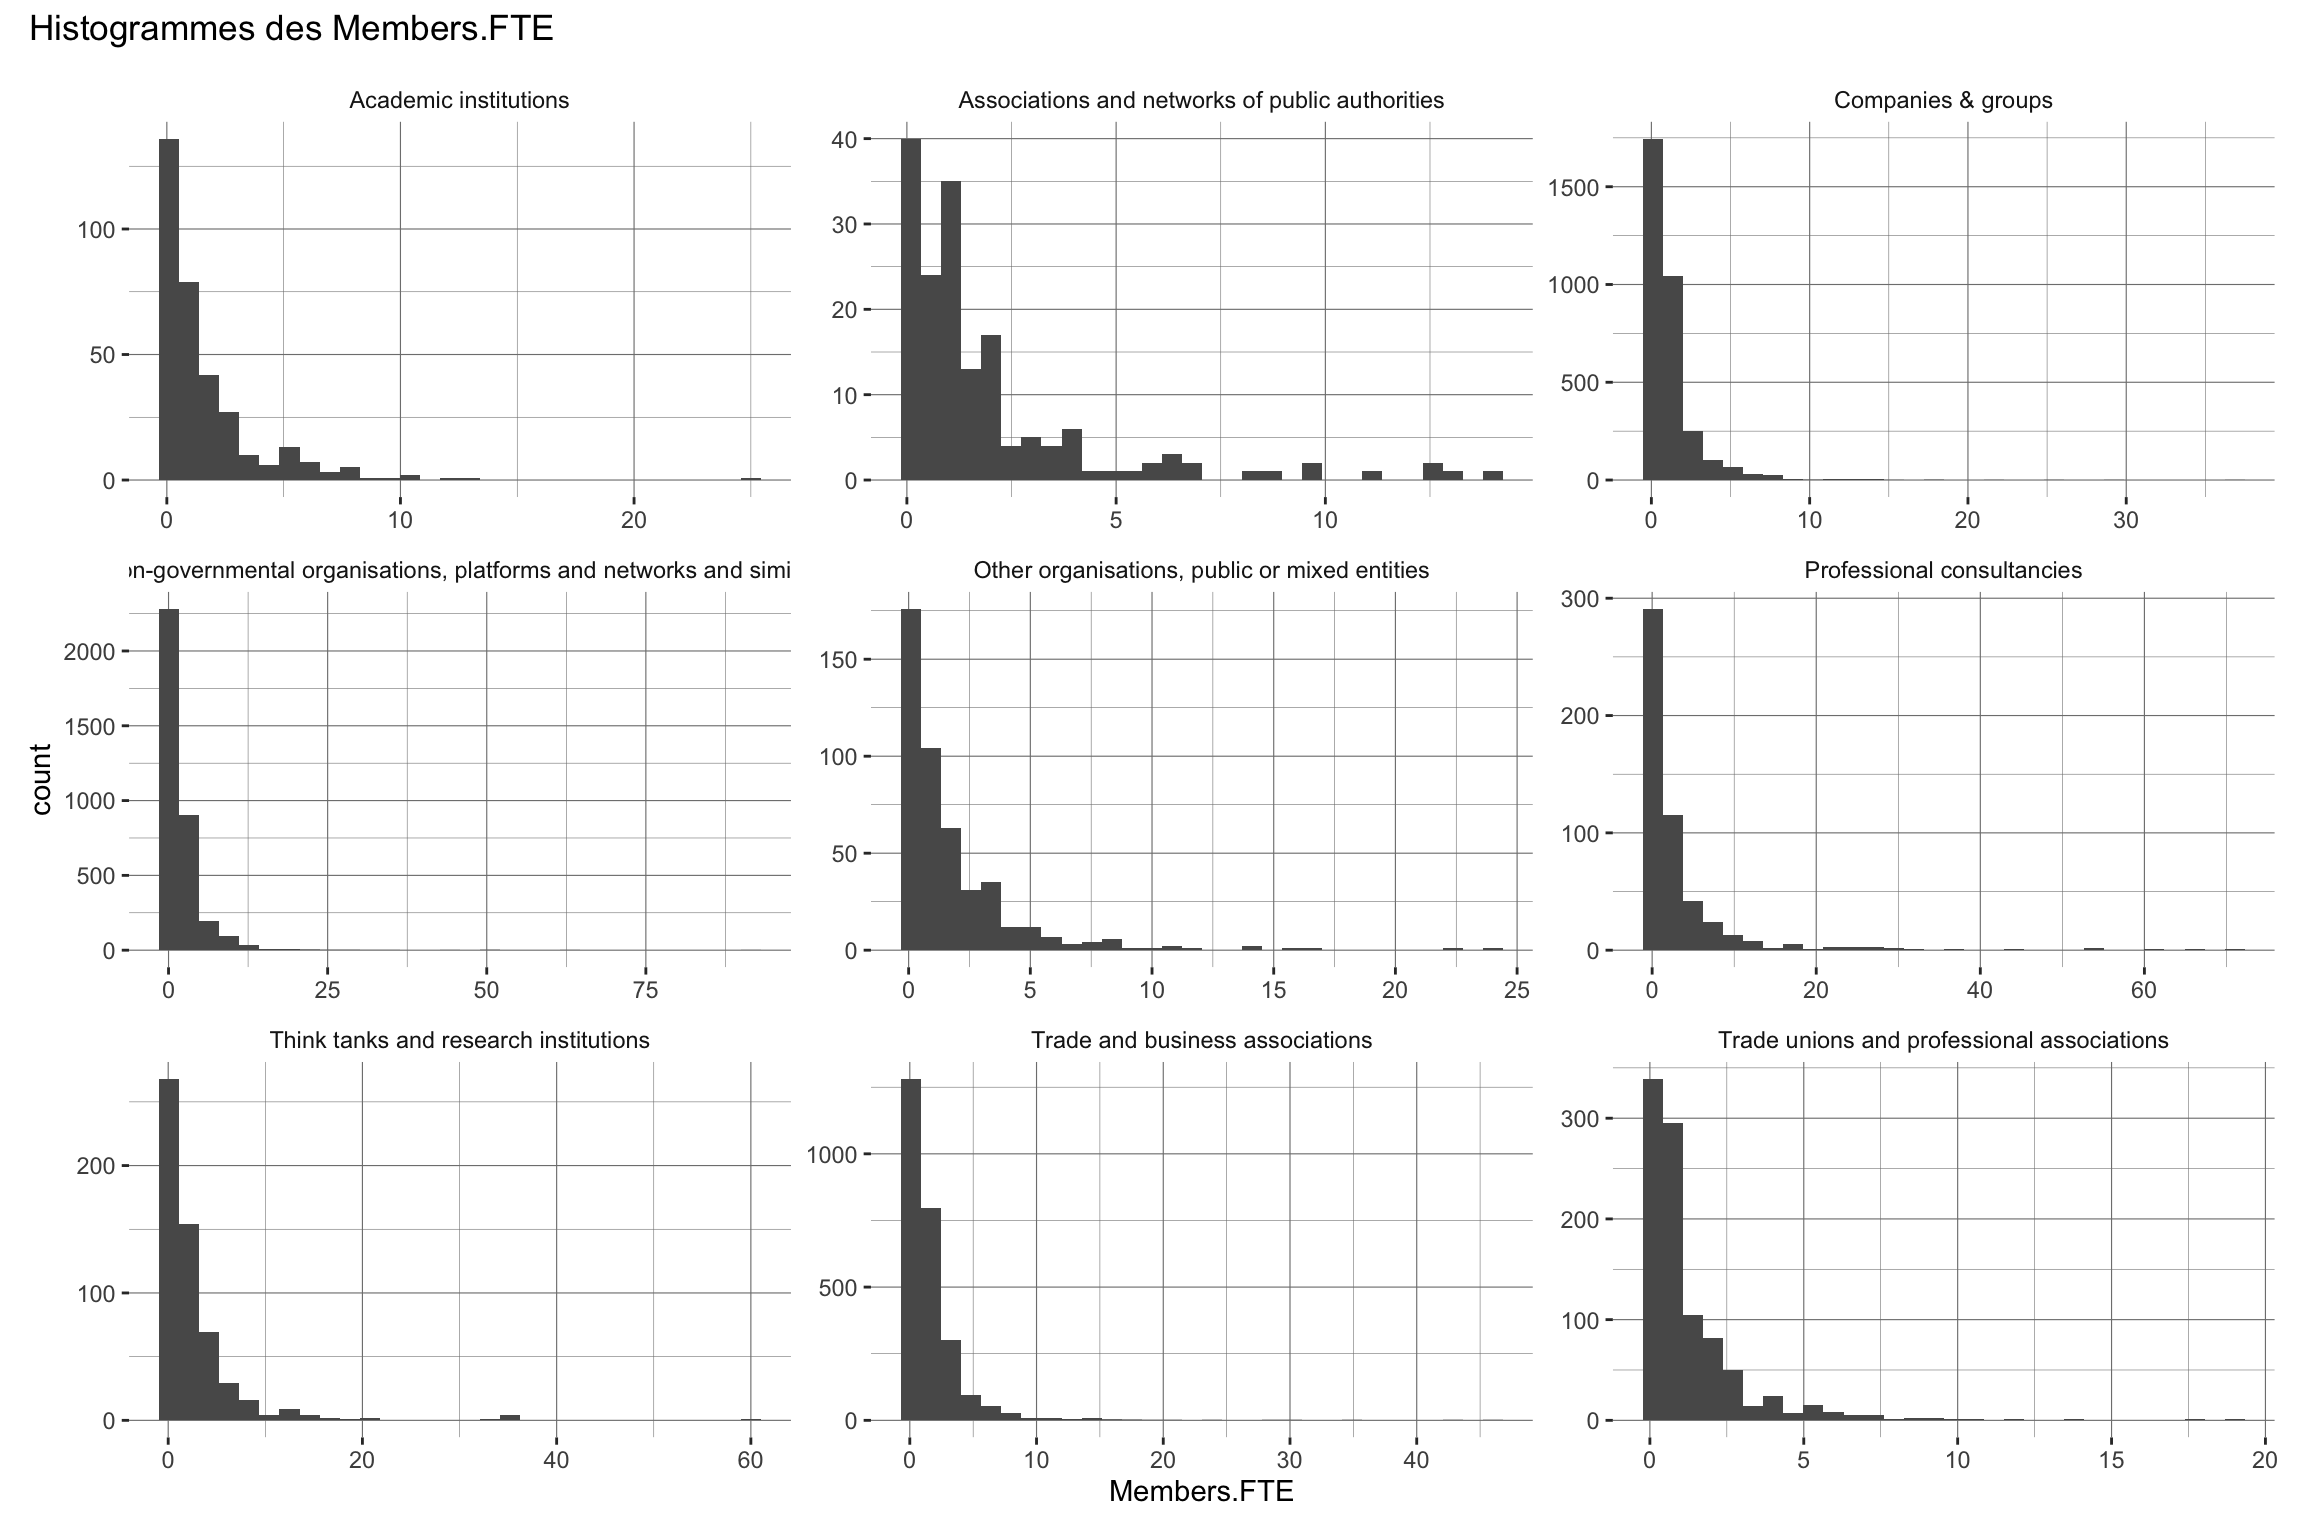
`stat_bin()` using `bins = 30`. Pick better value `binwidth`.


`stat_bin()` using `bins = 30`. Pick better value `binwidth`.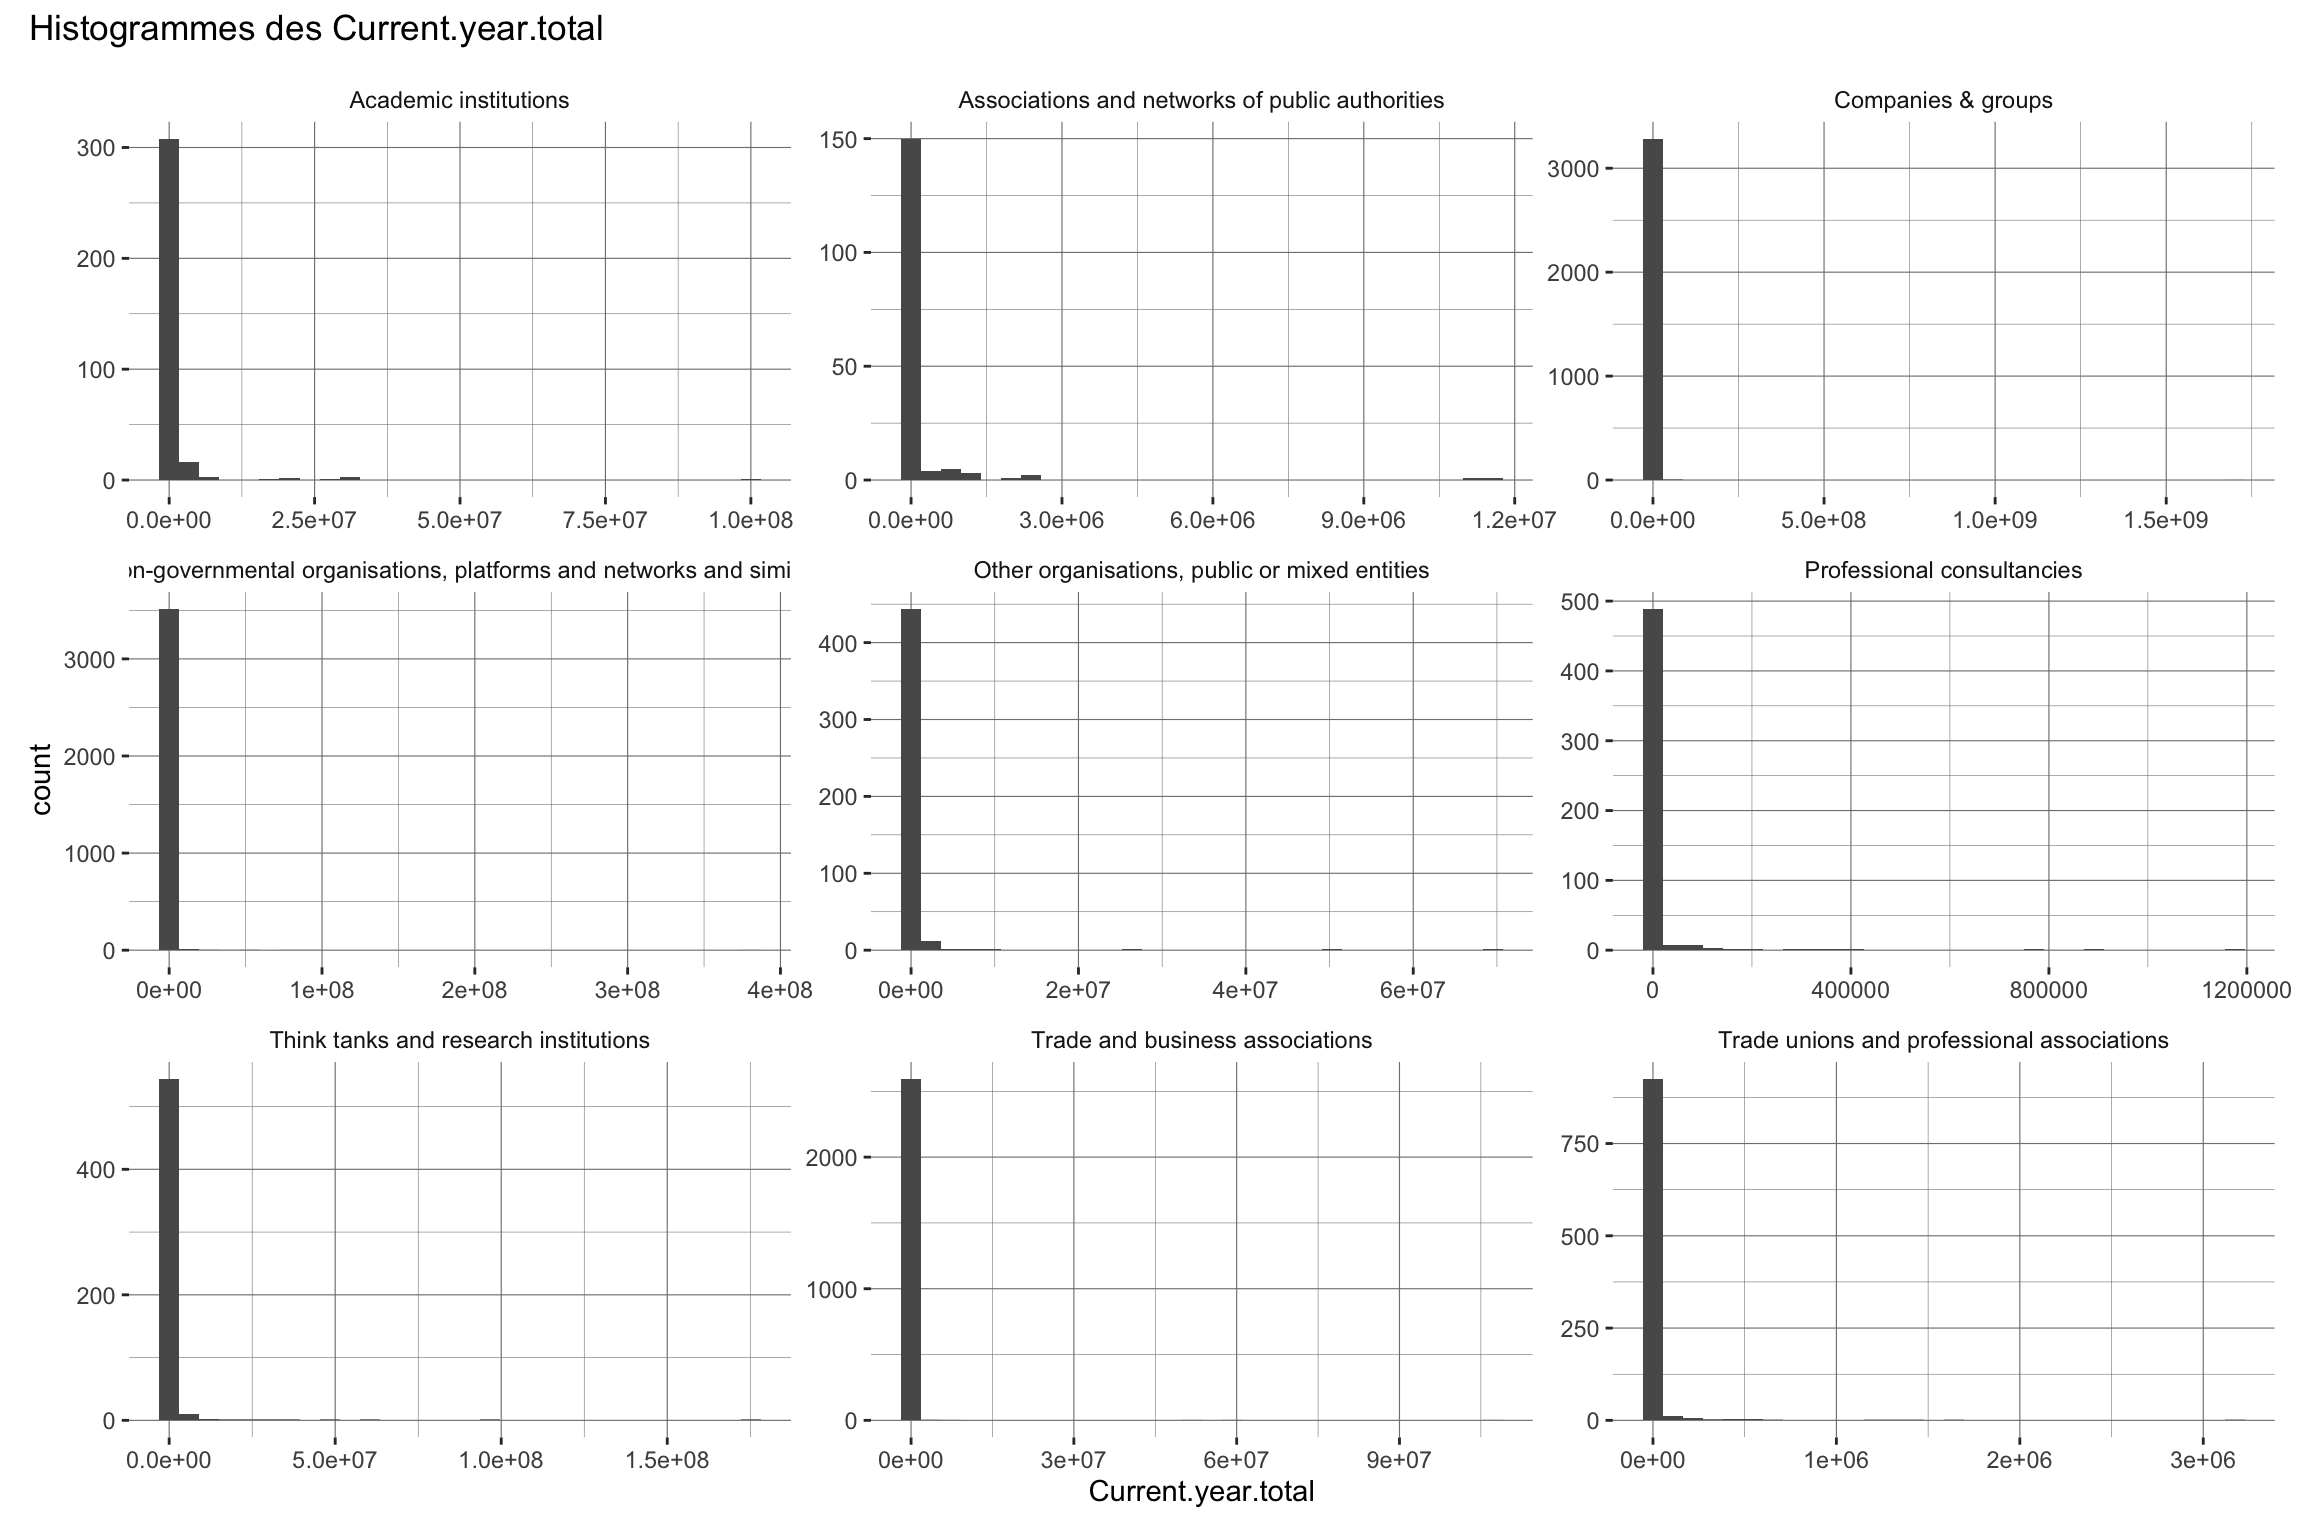
`stat_bin()` using `bins = 30`. Pick better value `binwidth`.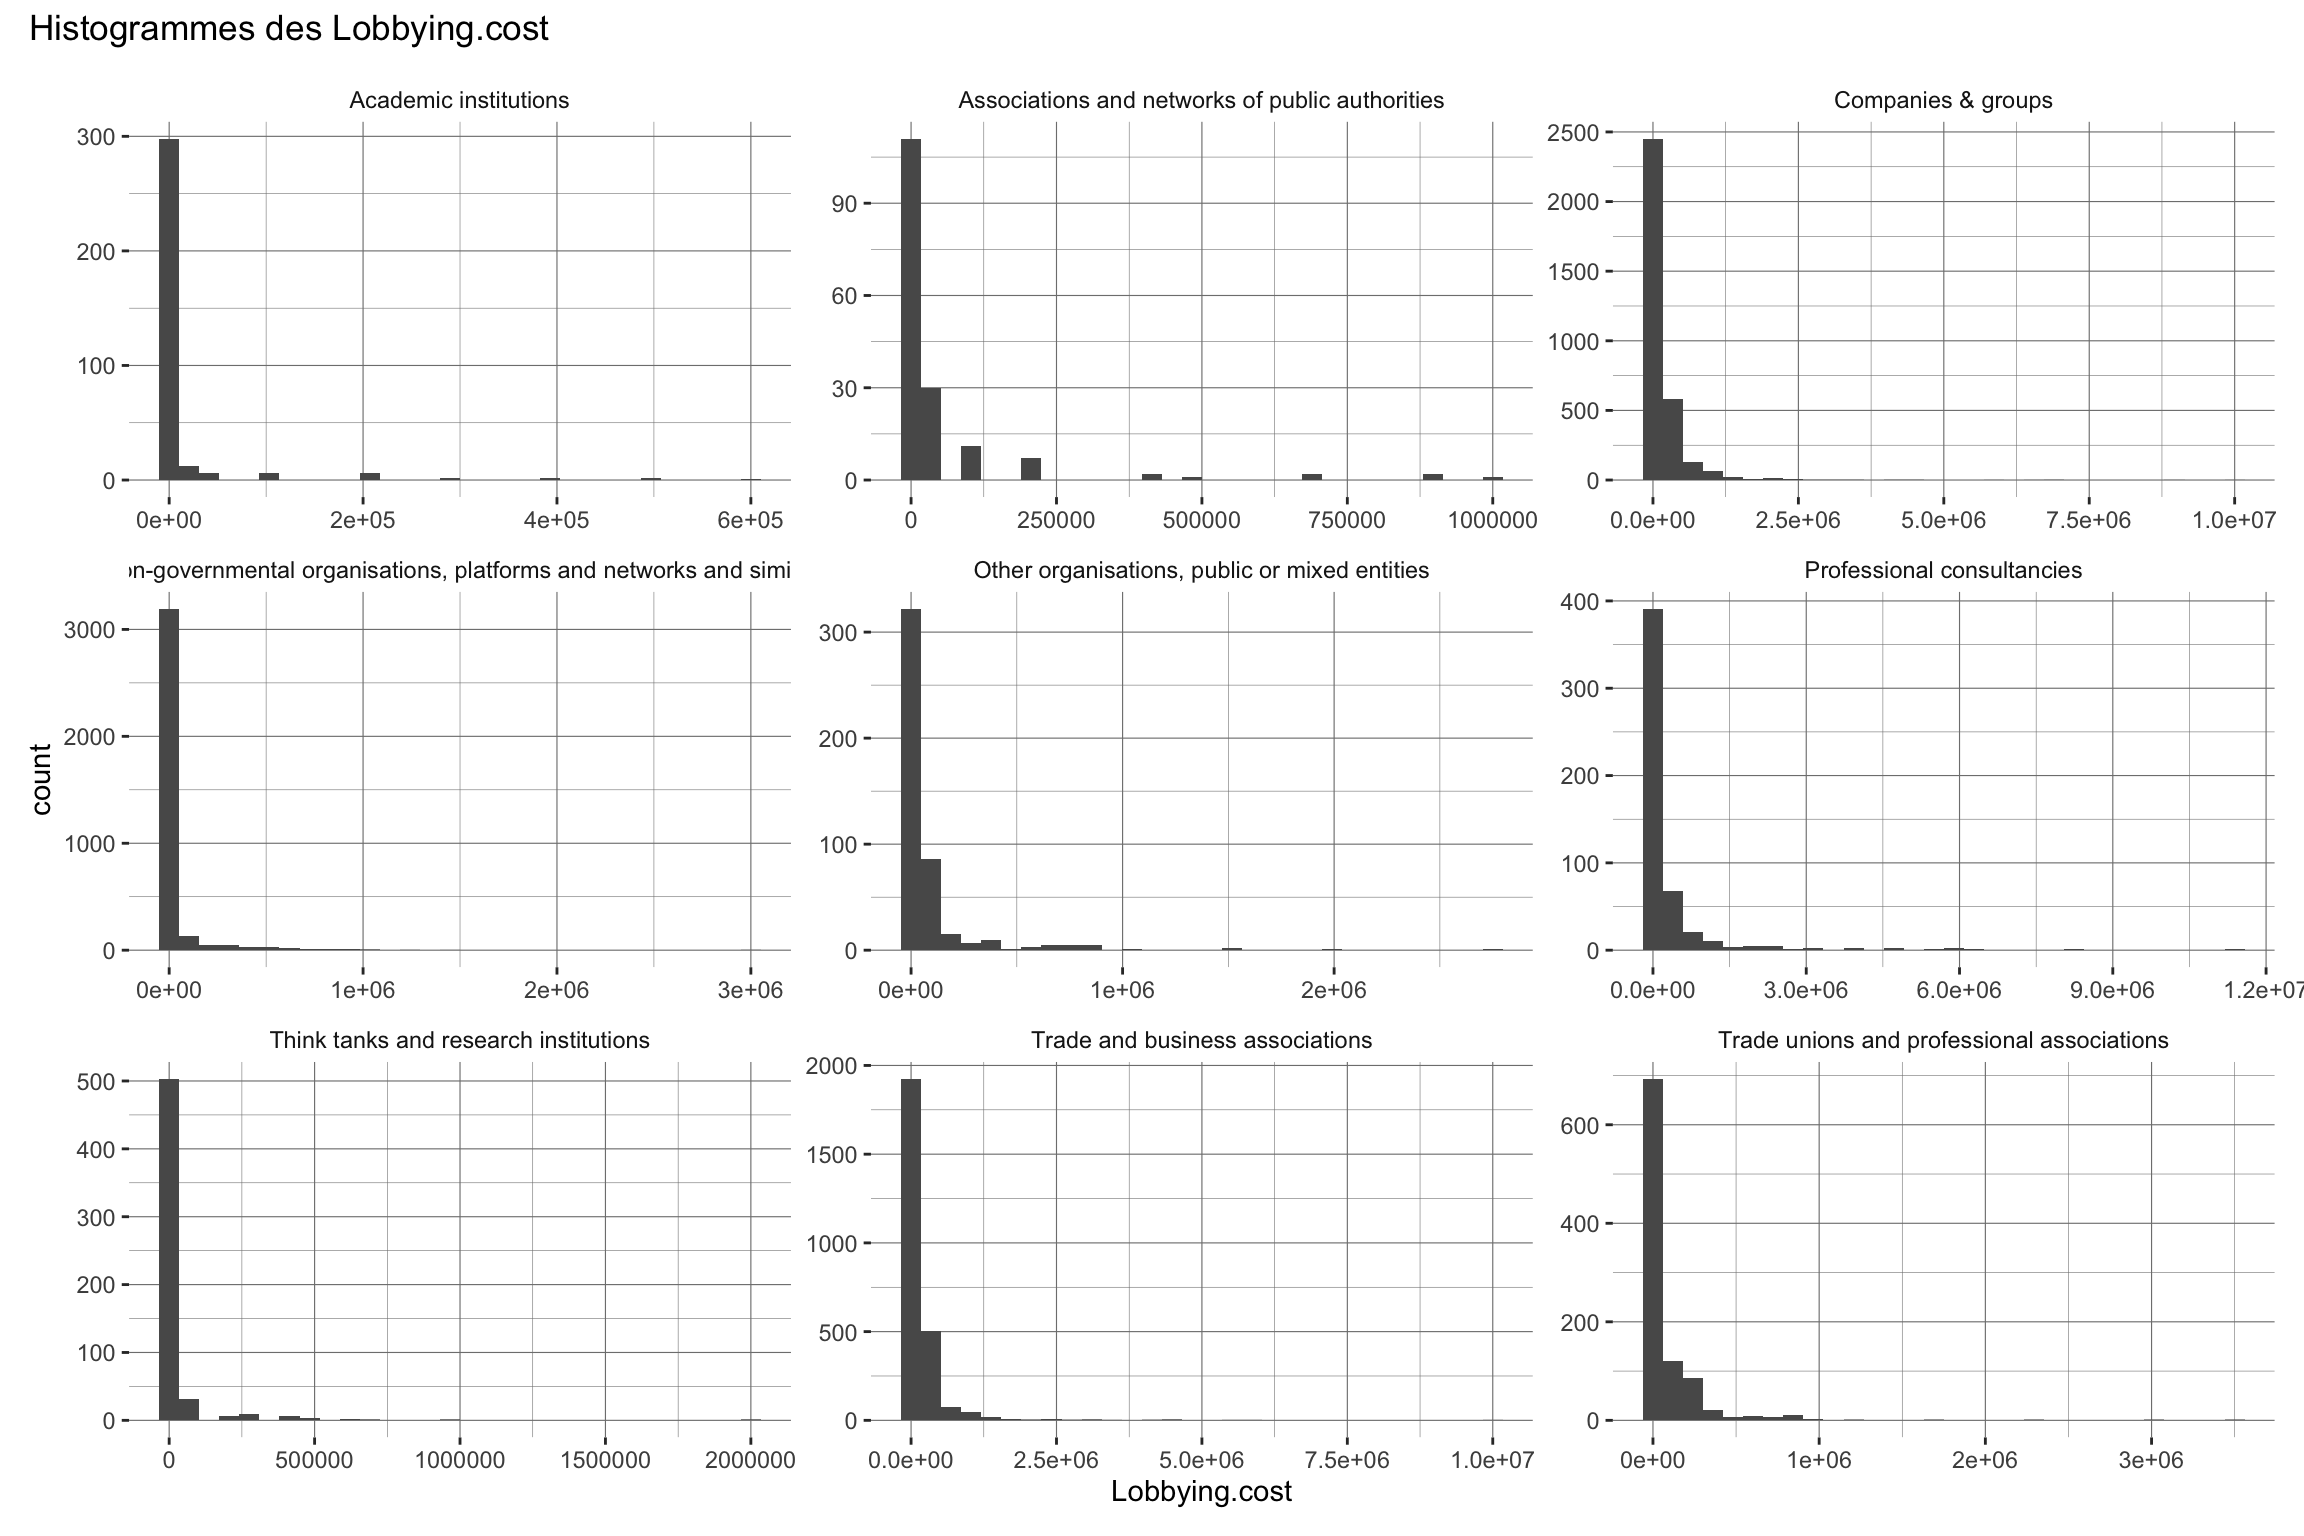
`stat_bin()` using `bins = 30`. Pick better value `binwidth`.
`stat_bin()` using `bins = 30`. Pick better value `binwidth`.
`stat_bin()` using `bins = 30`. Pick better value `binwidth`.
`stat_bin()` using `bins = 30`. Pick better value `binwidth`.
`stat_bin()` using `bins = 30`. Pick better value `binwidth`.

| Category.of.registration | n_ETP | Percent | mean_orga | nb_orga |
|---|---|---|---|---|
| Non-governmental organisations, platforms and networks and similar | 7317.95 | 33.15 | 2.067218 | 3540 |
| Trade and business associations | 4312.90 | 19.54 | 1.658808 | 2600 |
| Companies & groups | 4003.95 | 18.14 | 1.216267 | 3292 |
| Professional consultancies | 1861.40 | 8.43 | 3.579615 | 520 |
| Think tanks and research institutions | 1574.50 | 7.13 | 2.791667 | 564 |
| Trade unions and professional associations | 1223.70 | 5.54 | 1.274687 | 960 |
| Other organisations, public or mixed entities | 862.20 | 3.91 | 1.858190 | 464 |
| Academic institutions | 582.95 | 2.64 | 1.740149 | 335 |
| Associations and networks of public authorities | 334.05 | 1.51 | 2.000299 | 167 |
`summarise()` has grouped output by 'In_EG'. You can override using the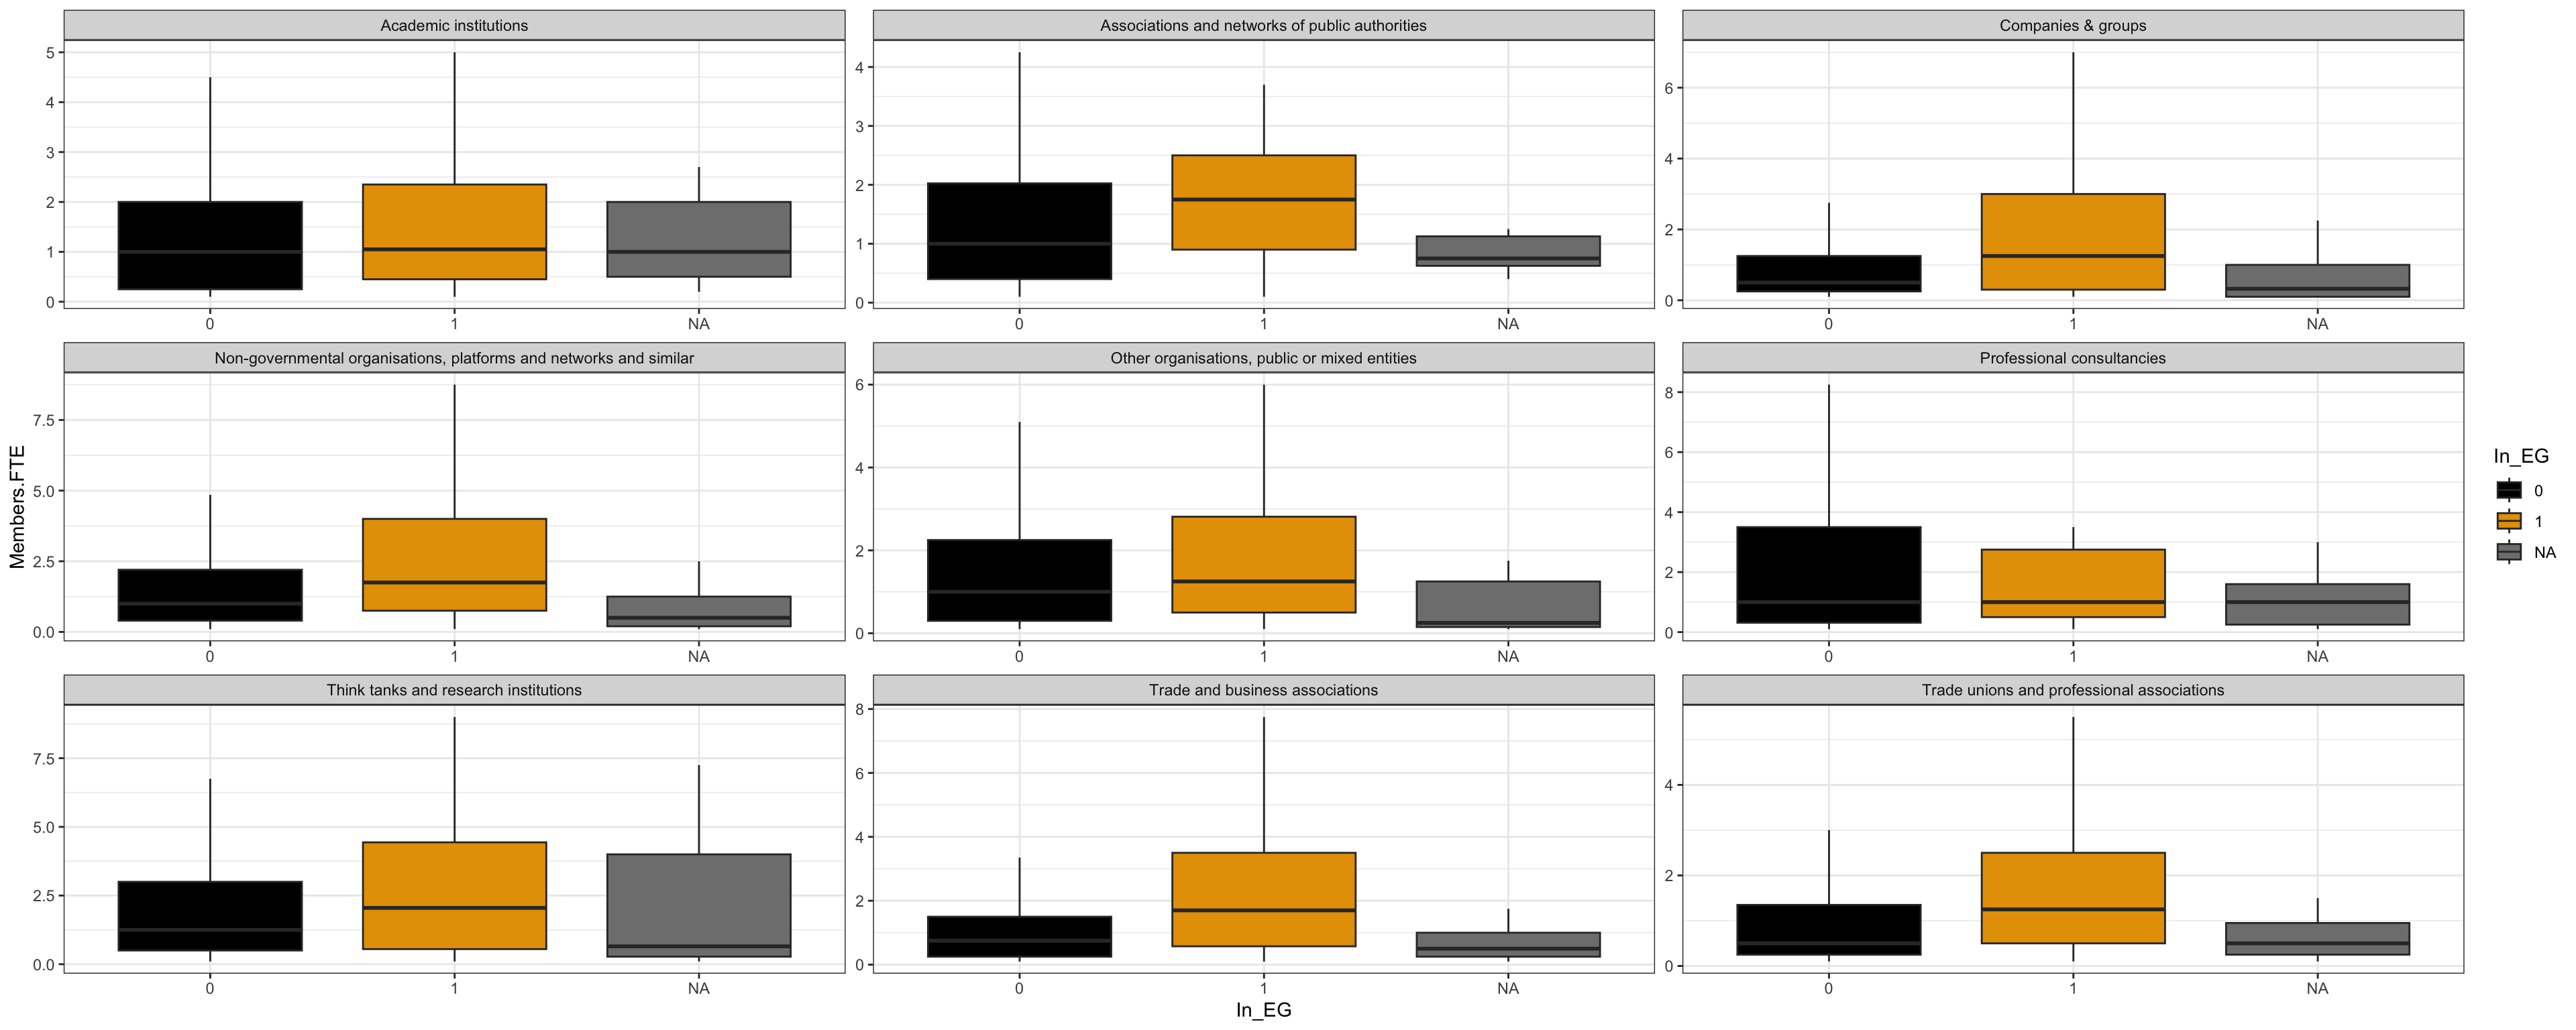
`.groups` argument.| Nombre d'ETP dans les organisations | ||||||||
| En fonction du type d'organisations | ||||||||
| In_EG | n | min | q1 | med | q3 | max | Mean.FTE | sd.FTE |
|---|---|---|---|---|---|---|---|---|
| Academic institutions | ||||||||
| 0 | 255 | 0.1 | 0.25 | 1.00 | 2.00 | 25.00 | 1.736863 | 2.605826 |
| 1 | 67 | 0.1 | 0.45 | 1.05 | 2.35 | 9.00 | 1.792537 | 1.969776 |
| Associations and networks of public authorities | ||||||||
| 0 | 131 | 0.1 | 0.40 | 1.00 | 2.02 | 13.00 | 1.871374 | 2.539443 |
| 1 | 29 | 0.1 | 0.90 | 1.75 | 2.50 | 14.00 | 2.663793 | 3.244966 |
| Companies & groups | ||||||||
| 0 | 2727 | 0.1 | 0.25 | 0.50 | 1.25 | 29.75 | 1.071030 | 1.557618 |
| 1 | 443 | 0.1 | 0.30 | 1.25 | 3.00 | 36.85 | 2.226185 | 3.219214 |
| Non-governmental organisations, platforms and networks and similar | ||||||||
| 0 | 2862 | 0.1 | 0.40 | 1.00 | 2.20 | 91.50 | 1.833753 | 3.108770 |
| 1 | 549 | 0.1 | 0.75 | 1.75 | 4.00 | 62.25 | 3.421038 | 5.056722 |
| Other organisations, public or mixed entities | ||||||||
| 0 | 393 | 0.1 | 0.30 | 1.00 | 2.25 | 24.00 | 1.767048 | 2.502048 |
| 1 | 56 | 0.1 | 0.50 | 1.25 | 2.81 | 16.25 | 2.765179 | 3.879491 |
| Professional consultancies | ||||||||
| 0 | 450 | 0.1 | 0.31 | 1.00 | 3.50 | 71.00 | 3.851556 | 8.281492 |
| 1 | 13 | 0.1 | 0.50 | 1.00 | 2.75 | 26.00 | 3.530769 | 6.994419 |
| Think tanks and research institutions | ||||||||
| 0 | 451 | 0.1 | 0.50 | 1.25 | 3.00 | 60.00 | 2.692683 | 5.049851 |
| 1 | 90 | 0.1 | 0.55 | 2.05 | 4.44 | 35.00 | 3.361111 | 4.668270 |
| Trade and business associations | ||||||||
| 0 | 1874 | 0.1 | 0.25 | 0.75 | 1.50 | 19.25 | 1.263687 | 1.623185 |
| 1 | 663 | 0.1 | 0.58 | 1.70 | 3.50 | 46.00 | 2.860633 | 4.247329 |
| Trade unions and professional associations | ||||||||
| 0 | 733 | 0.1 | 0.25 | 0.50 | 1.35 | 14.00 | 1.066576 | 1.345904 |
| 1 | 189 | 0.1 | 0.50 | 1.25 | 2.50 | 19.00 | 2.193915 | 2.731578 |
| Characteristic |
In_EG
|
No_EG
|
||
|---|---|---|---|---|
| N = 2,0991 | p-value2 | N = 9,8761 | p-value2 | |
| Category.of.registration | <0.001 | <0.001 | ||
| Academic institutions | 1.05 (0.40, 2.45) | 1.00 (0.25, 2.00) | ||
| Associations and networks of public authorities | 1.75 (0.90, 2.50) | 1.00 (0.30, 2.05) | ||
| Companies & groups | 1.25 (0.30, 3.00) | 0.50 (0.25, 1.25) | ||
| Non-governmental organisations, platforms and networks and similar | 1.75 (0.75, 4.00) | 1.00 (0.40, 2.20) | ||
| Other organisations, public or mixed entities | 1.25 (0.50, 2.88) | 1.00 (0.30, 2.25) | ||
| Professional consultancies | 1.00 (0.50, 2.75) | 1.00 (0.30, 3.50) | ||
| Think tanks and research institutions | 2.05 (0.50, 4.50) | 1.25 (0.50, 3.00) | ||
| Trade and business associations | 1.70 (0.55, 3.50) | 0.75 (0.25, 1.50) | ||
| Trade unions and professional associations | 1.25 (0.50, 2.50) | 0.50 (0.25, 1.35) | ||
| 1 Members.FTE: Median (Q1, Q3) | ||||
| 2 Kruskal-Wallis rank sum test | ||||
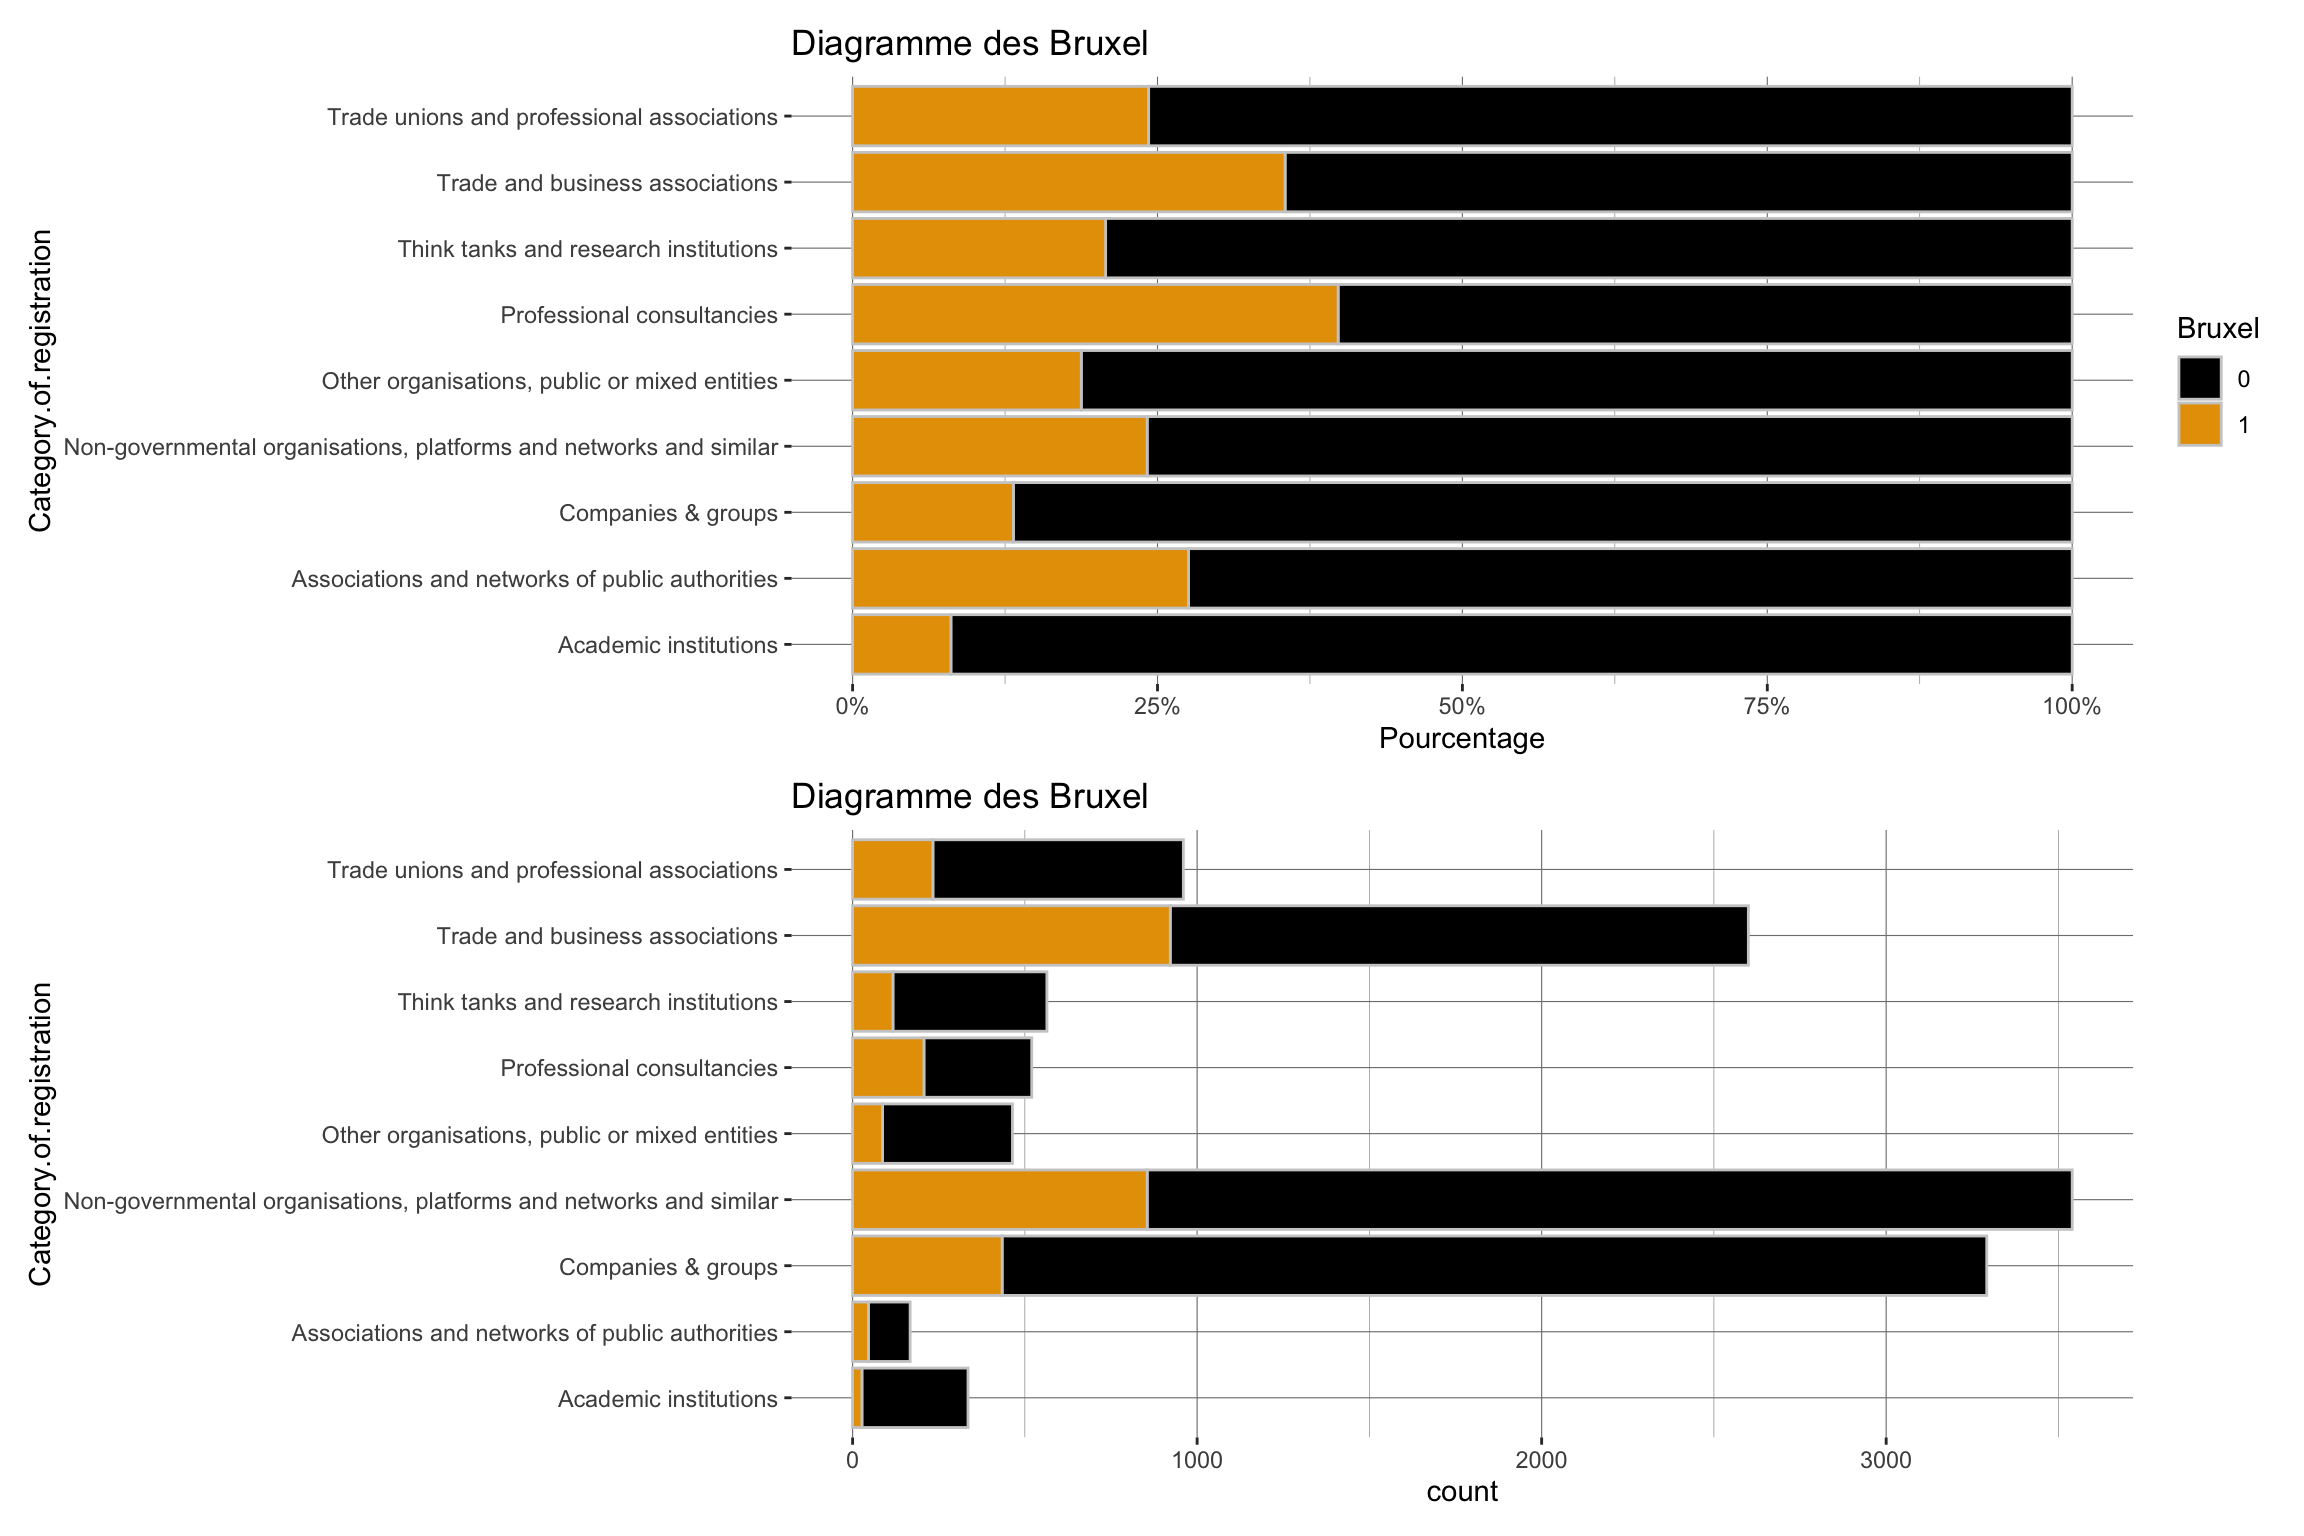
| Characteristic | In_Bruxel N = 2,9281 |
No_Bruxel N = 9,5141 |
p-value2 |
|---|---|---|---|
| Category.of.registration | <0.001 | ||
| Academic institutions | 27 (0.9%) | 308 (3.2%) | |
| Associations and networks of public authorities | 46 (1.6%) | 121 (1.3%) | |
| Companies & groups | 434 (15%) | 2,858 (30%) | |
| Non-governmental organisations, platforms and networks and similar | 855 (29%) | 2,685 (28%) | |
| Other organisations, public or mixed entities | 87 (3.0%) | 377 (4.0%) | |
| Professional consultancies | 207 (7.1%) | 313 (3.3%) | |
| Think tanks and research institutions | 117 (4.0%) | 447 (4.7%) | |
| Trade and business associations | 922 (31%) | 1,678 (18%) | |
| Trade unions and professional associations | 233 (8.0%) | 727 (7.6%) | |
| 1 n (%) | |||
| 2 Pearson’s Chi-squared test | |||
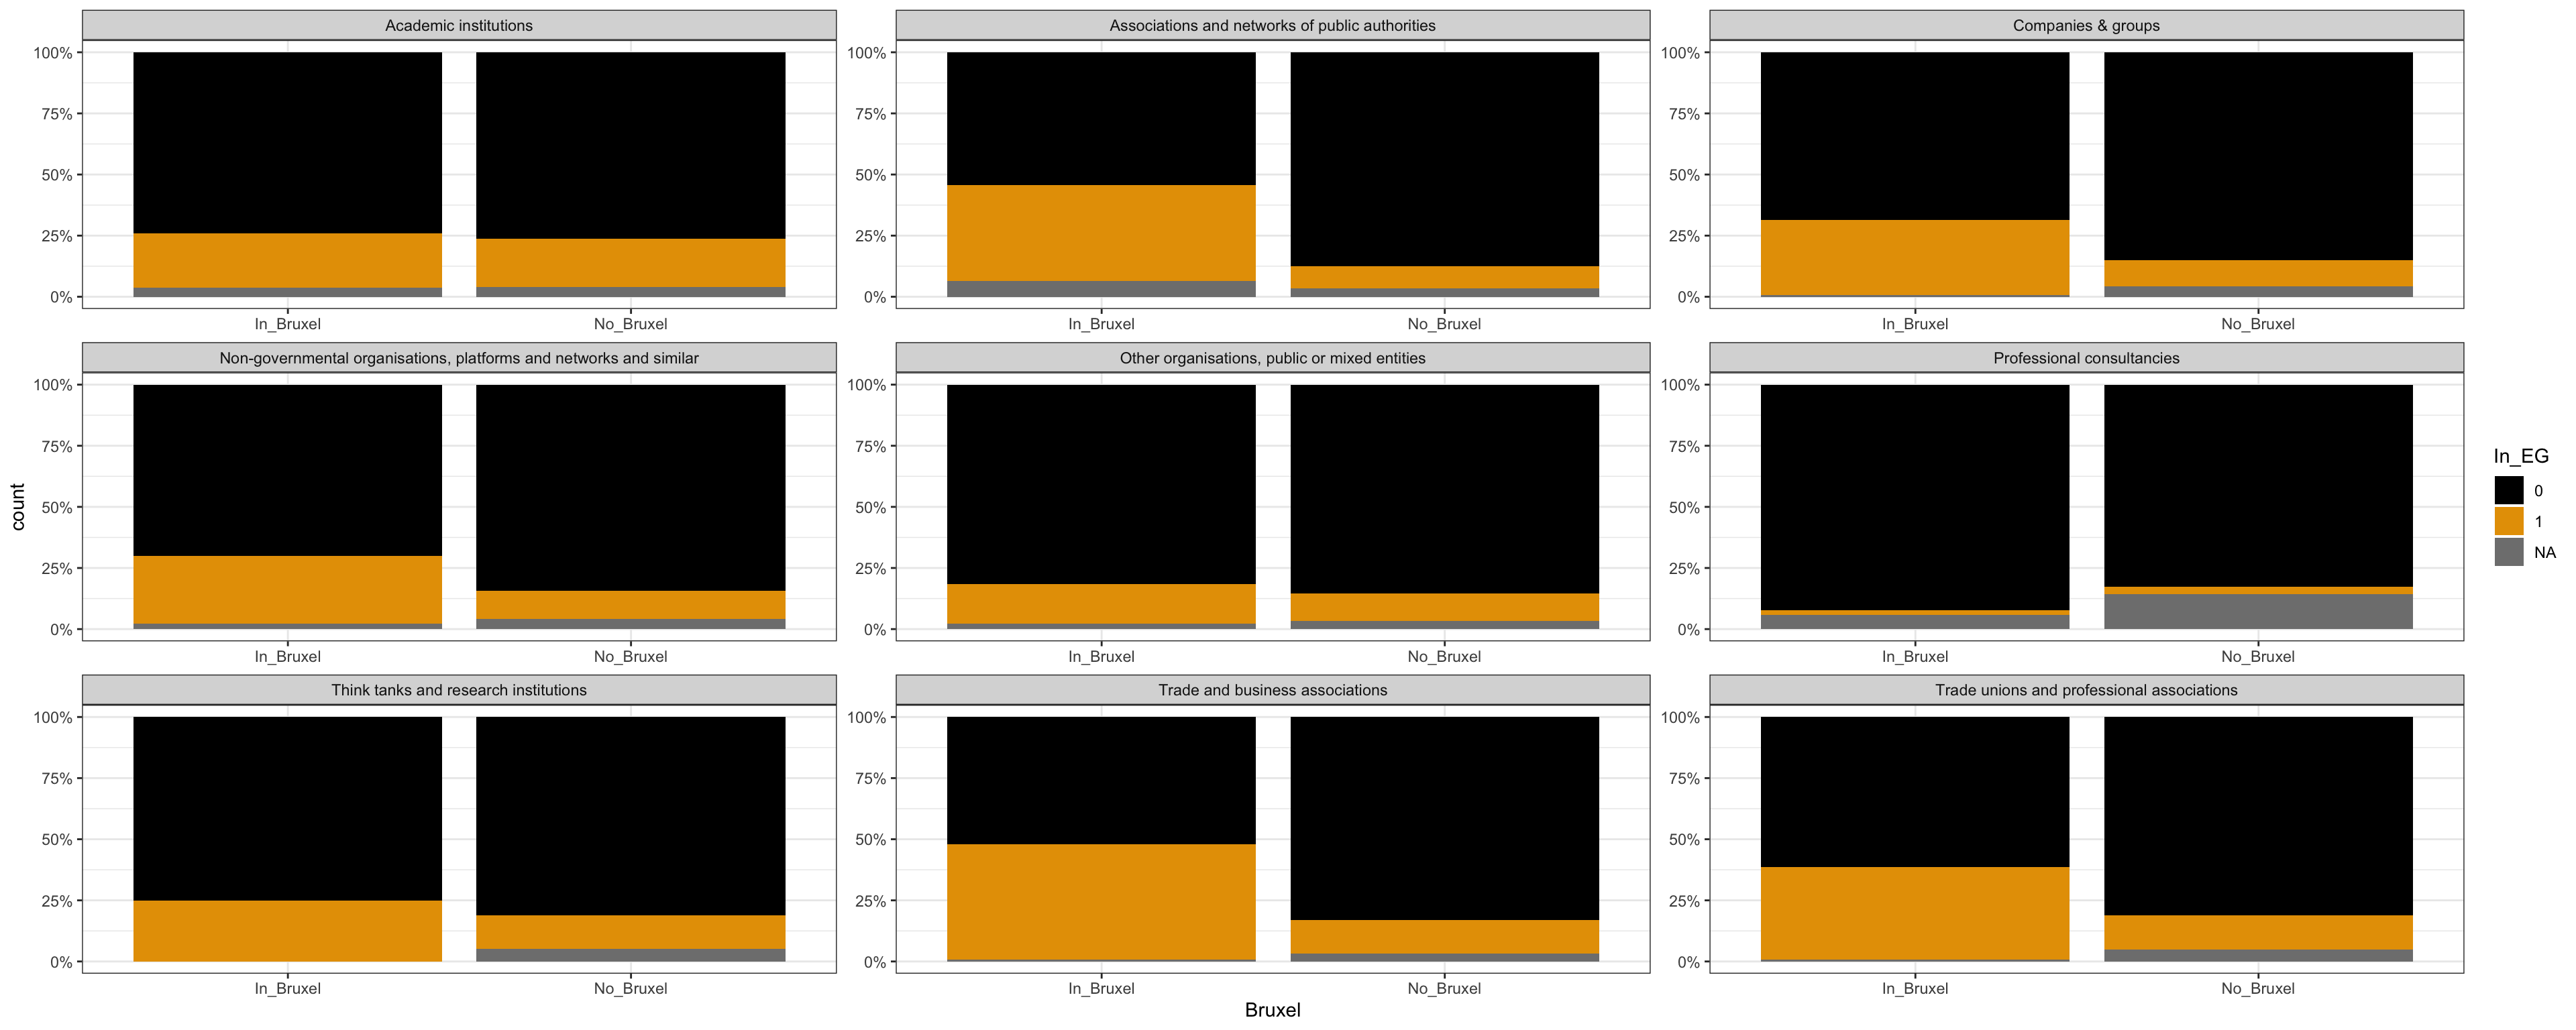
| Characteristic |
In_EG
|
No_EG
|
||||
|---|---|---|---|---|---|---|
| In_Bruxel N = 9641 |
No_Bruxel N = 1,1351 |
p-value2 | In_Bruxel N = 1,9151 |
No_Bruxel N = 7,9611 |
p-value2 | |
| Category.of.registration | <0.001 | <0.001 | ||||
| Academic institutions | 6 (0.6%) | 61 (5.4%) | 20 (1.0%) | 235 (3.0%) | ||
| Associations and networks of public authorities | 18 (1.9%) | 11 (1.0%) | 25 (1.3%) | 106 (1.3%) | ||
| Companies & groups | 133 (14%) | 310 (27%) | 298 (16%) | 2,429 (31%) | ||
| Non-governmental organisations, platforms and networks and similar | 237 (25%) | 312 (27%) | 600 (31%) | 2,262 (28%) | ||
| Other organisations, public or mixed entities | 14 (1.5%) | 42 (3.7%) | 71 (3.7%) | 322 (4.0%) | ||
| Professional consultancies | 4 (0.4%) | 9 (0.8%) | 191 (10.0%) | 259 (3.3%) | ||
| Think tanks and research institutions | 29 (3.0%) | 61 (5.4%) | 88 (4.6%) | 363 (4.6%) | ||
| Trade and business associations | 435 (45%) | 228 (20%) | 479 (25%) | 1,395 (18%) | ||
| Trade unions and professional associations | 88 (9.1%) | 101 (8.9%) | 143 (7.5%) | 590 (7.4%) | ||
| 1 n (%) | ||||||
| 2 Pearson’s Chi-squared test | ||||||
| Characteristic |
In_EG
|
No_EG
|
||
|---|---|---|---|---|
| N = 2,0991 | p-value2 | N = 9,8761 | p-value2 | |
| Category.of.registration | <0.001 | <0.001 | ||
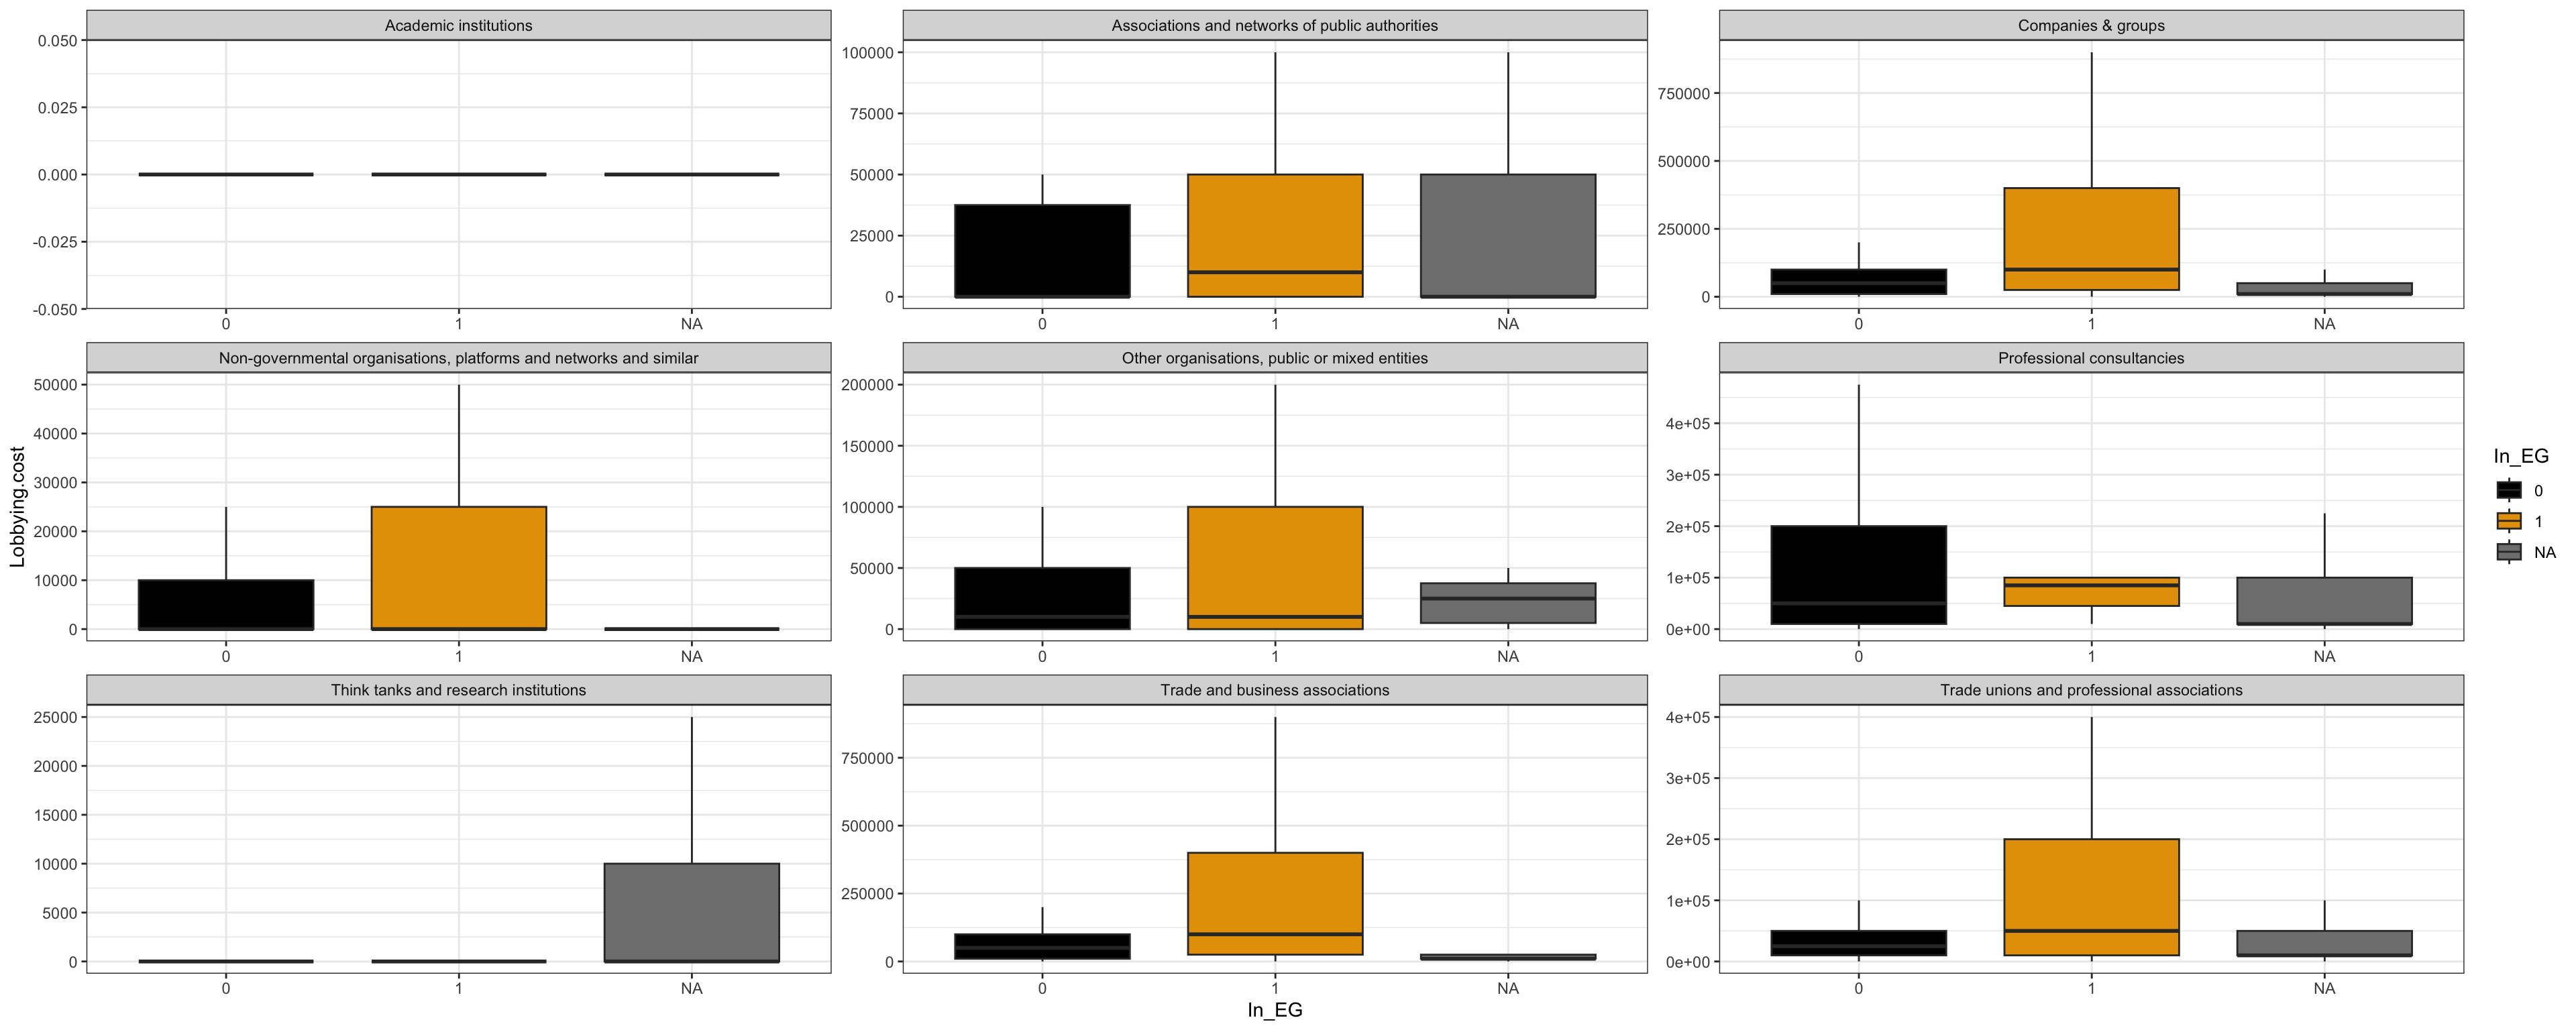
| Academic institutions | 0 (0, 0) | 0 (0, 0) | ||
| Associations and networks of public authorities | 10,000 (0, 50,000) | 0 (0, 50,000) | ||
| Companies & groups | 100,000 (25,000, 400,000) | 50,000 (10,000, 100,000) | ||
| Non-governmental organisations, platforms and networks and similar | 0 (0, 25,000) | 0 (0, 10,000) | ||
| Other organisations, public or mixed entities | 10,000 (0, 100,000) | 10,000 (0, 50,000) | ||
| Professional consultancies | 85,000 (45,000, 100,000) | 50,000 (10,000, 200,000) | ||
| Think tanks and research institutions | 0 (0, 0) | 0 (0, 0) | ||
| Trade and business associations | 100,000 (25,000, 400,000) | 50,000 (10,000, 100,000) | ||
| Trade unions and professional associations | 50,000 (10,000, 200,000) | 25,000 (10,000, 50,000) | ||
| 1 Lobbying.cost: Median (Q1, Q3) | ||||
| 2 Kruskal-Wallis rank sum test | ||||
`summarise()` has grouped output by 'In_EG'. You can override using the
`.groups` argument.| Nombre d'ETP dans les organisations | ||||||||
| En fonction du type d'organisations | ||||||||
| In_EG | n | min | q1 | med | q3 | max | Mean.FTE | sd.FTE |
|---|---|---|---|---|---|---|---|---|
| Academic institutions | ||||||||
| 0 | 255 | 0 | 0 | 0 | 0 | 600000 | 18509.80 | 73724.96 |
| 1 | 67 | 0 | 0 | 0 | 0 | 400000 | 12238.81 | 55310.99 |
| Associations and networks of public authorities | ||||||||
| 0 | 131 | 0 | 0 | 0 | 37500 | 1000000 | 59541.98 | 170097.77 |
| 1 | 29 | 0 | 0 | 10000 | 50000 | 500000 | 50517.24 | 102993.97 |
| Companies & groups | ||||||||
| 0 | 2727 | 0 | 10000 | 50000 | 100000 | 10000000 | 140385.04 | 340263.16 |
| 1 | 443 | 0 | 25000 | 100000 | 400000 | 9000000 | 434187.36 | 926419.43 |
| Non-governmental organisations, platforms and networks and similar | ||||||||
| 0 | 2862 | 0 | 0 | 0 | 10000 | 3000000 | 28810.27 | 119176.11 |
| 1 | 549 | 0 | 0 | 0 | 25000 | 3000000 | 82194.90 | 232317.47 |
| Other organisations, public or mixed entities | ||||||||
| 0 | 393 | 0 | 0 | 10000 | 50000 | 1500000 | 74389.31 | 183822.46 |
| 1 | 56 | 0 | 0 | 10000 | 100000 | 2750000 | 183928.57 | 504890.37 |
| Professional consultancies | ||||||||
| 0 | 450 | 0 | 10000 | 50000 | 200000 | 11385000 | 361822.22 | 1050366.84 |
| 1 | 13 | 10000 | 45000 | 85000 | 100000 | 1930000 | 245384.62 | 528888.23 |
| Think tanks and research institutions | ||||||||
| 0 | 451 | 0 | 0 | 0 | 0 | 600000 | 23381.37 | 81660.11 |
| 1 | 90 | 0 | 0 | 0 | 0 | 2000000 | 59944.44 | 252291.18 |
| Trade and business associations | ||||||||
| 0 | 1874 | 0 | 10000 | 50000 | 100000 | 4500000 | 121093.92 | 253325.15 |
| 1 | 663 | 0 | 25000 | 100000 | 400000 | 10000000 | 338099.55 | 732566.99 |
| Trade unions and professional associations | ||||||||
| 0 | 733 | 0 | 10000 | 25000 | 50000 | 3500000 | 75272.85 | 193589.00 |
| 1 | 189 | 0 | 10000 | 50000 | 200000 | 3000000 | 183492.06 | 337146.55 |
| Characteristic | Has_grant N = 1,4631 |
No_grant N = 10,9791 |
p-value2 |
|---|---|---|---|
| Category.of.registration | <0.001 | ||
| Academic institutions | 63 (4.3%) | 272 (2.5%) | |
| Associations and networks of public authorities | 25 (1.7%) | 142 (1.3%) | |
| Companies & groups | 236 (16%) | 3,056 (28%) | |
| Non-governmental organisations, platforms and networks and similar | 721 (49%) | 2,819 (26%) | |
| Other organisations, public or mixed entities | 67 (4.6%) | 397 (3.6%) | |
| Professional consultancies | 34 (2.3%) | 486 (4.4%) | |
| Think tanks and research institutions | 123 (8.4%) | 441 (4.0%) | |
| Trade and business associations | 132 (9.0%) | 2,468 (22%) | |
| Trade unions and professional associations | 62 (4.2%) | 898 (8.2%) | |
| 1 n (%) | |||
| 2 Pearson’s Chi-squared test | |||
The following errors were returned during `tbl_strata()`:
✖ For variable `Category.of.registration` (`Has_EU_grant`) and "estimate",
  "p.value", "conf.low", and "conf.high" statistics: FEXACT erreur 7(location).
  LDSTP=18270 est trop petit pour ce problème, (pastp=65.2352,
  ipn_0:=ipoin[itp=548]=8329, stp[ipn_0]=61.0695). Augmentez la taille de
  l’environnement de travail ou considérez l’utilisation de
‘simulate.p.value=TRUE’.| Characteristic |
In_EG
|
No_EG
|
||||
|---|---|---|---|---|---|---|
| Has_grant N = 3651 |
No_grant N = 1,7341 |
p-value | Has_grant N = 1,0601 |
No_grant N = 8,8161 |
p-value2 | |
| Category.of.registration | <0.001 | |||||
| Academic institutions | 13 (3.6%) | 54 (3.1%) | 48 (4.5%) | 207 (2.3%) | ||
| Associations and networks of public authorities | 9 (2.5%) | 20 (1.2%) | 15 (1.4%) | 116 (1.3%) | ||
| Companies & groups | 41 (11%) | 402 (23%) | 188 (18%) | 2,539 (29%) | ||
| Non-governmental organisations, platforms and networks and similar | 177 (48%) | 372 (21%) | 529 (50%) | 2,333 (26%) | ||
| Other organisations, public or mixed entities | 14 (3.8%) | 42 (2.4%) | 51 (4.8%) | 342 (3.9%) | ||
| Professional consultancies | 5 (1.4%) | 8 (0.5%) | 24 (2.3%) | 426 (4.8%) | ||
| Think tanks and research institutions | 23 (6.3%) | 67 (3.9%) | 98 (9.2%) | 353 (4.0%) | ||
| Trade and business associations | 56 (15%) | 607 (35%) | 73 (6.9%) | 1,801 (20%) | ||
| Trade unions and professional associations | 27 (7.4%) | 162 (9.3%) | 34 (3.2%) | 699 (7.9%) | ||
| 1 n (%) | ||||||
| 2 Pearson’s Chi-squared test | ||||||

| Characteristic | N = 12,4421 |
|---|---|
| Category.of.registration | |
| Academic institutions | 0.0 (0.0 - 1.0) | 3.0 - 23.0 |
| Associations and networks of public authorities | 0.0 (0.0 - 1.0) | 6.0 - 27.0 |
| Companies & groups | 0.0 (0.0 - 2.0) | 11.0 - 372.0 |
| Non-governmental organisations, platforms and networks and similar | 0.0 (0.0 - 1.0) | 4.0 - 291.0 |
| Other organisations, public or mixed entities | 0.0 (0.0 - 1.0) | 4.0 - 81.0 |
| Professional consultancies | 0.0 (0.0 - 1.0) | 7.0 - 94.0 |
| Think tanks and research institutions | 0.0 (0.0 - 1.0) | 8.0 - 95.0 |
| Trade and business associations | 0.0 (0.0 - 2.0) | 11.0 - 443.0 |
| Trade unions and professional associations | 0.0 (0.0 - 1.0) | 5.0 - 252.0 |
| 1 Meetings: Median (Q1 - Q3) | 90% Centile - Max | |
| Characteristic |
In_EG
|
No_EG
|
||
|---|---|---|---|---|
| N = 2,0991 | p-value2 | N = 9,8761 | p-value2 | |
| Category.of.registration | <0.001 | <0.001 | ||
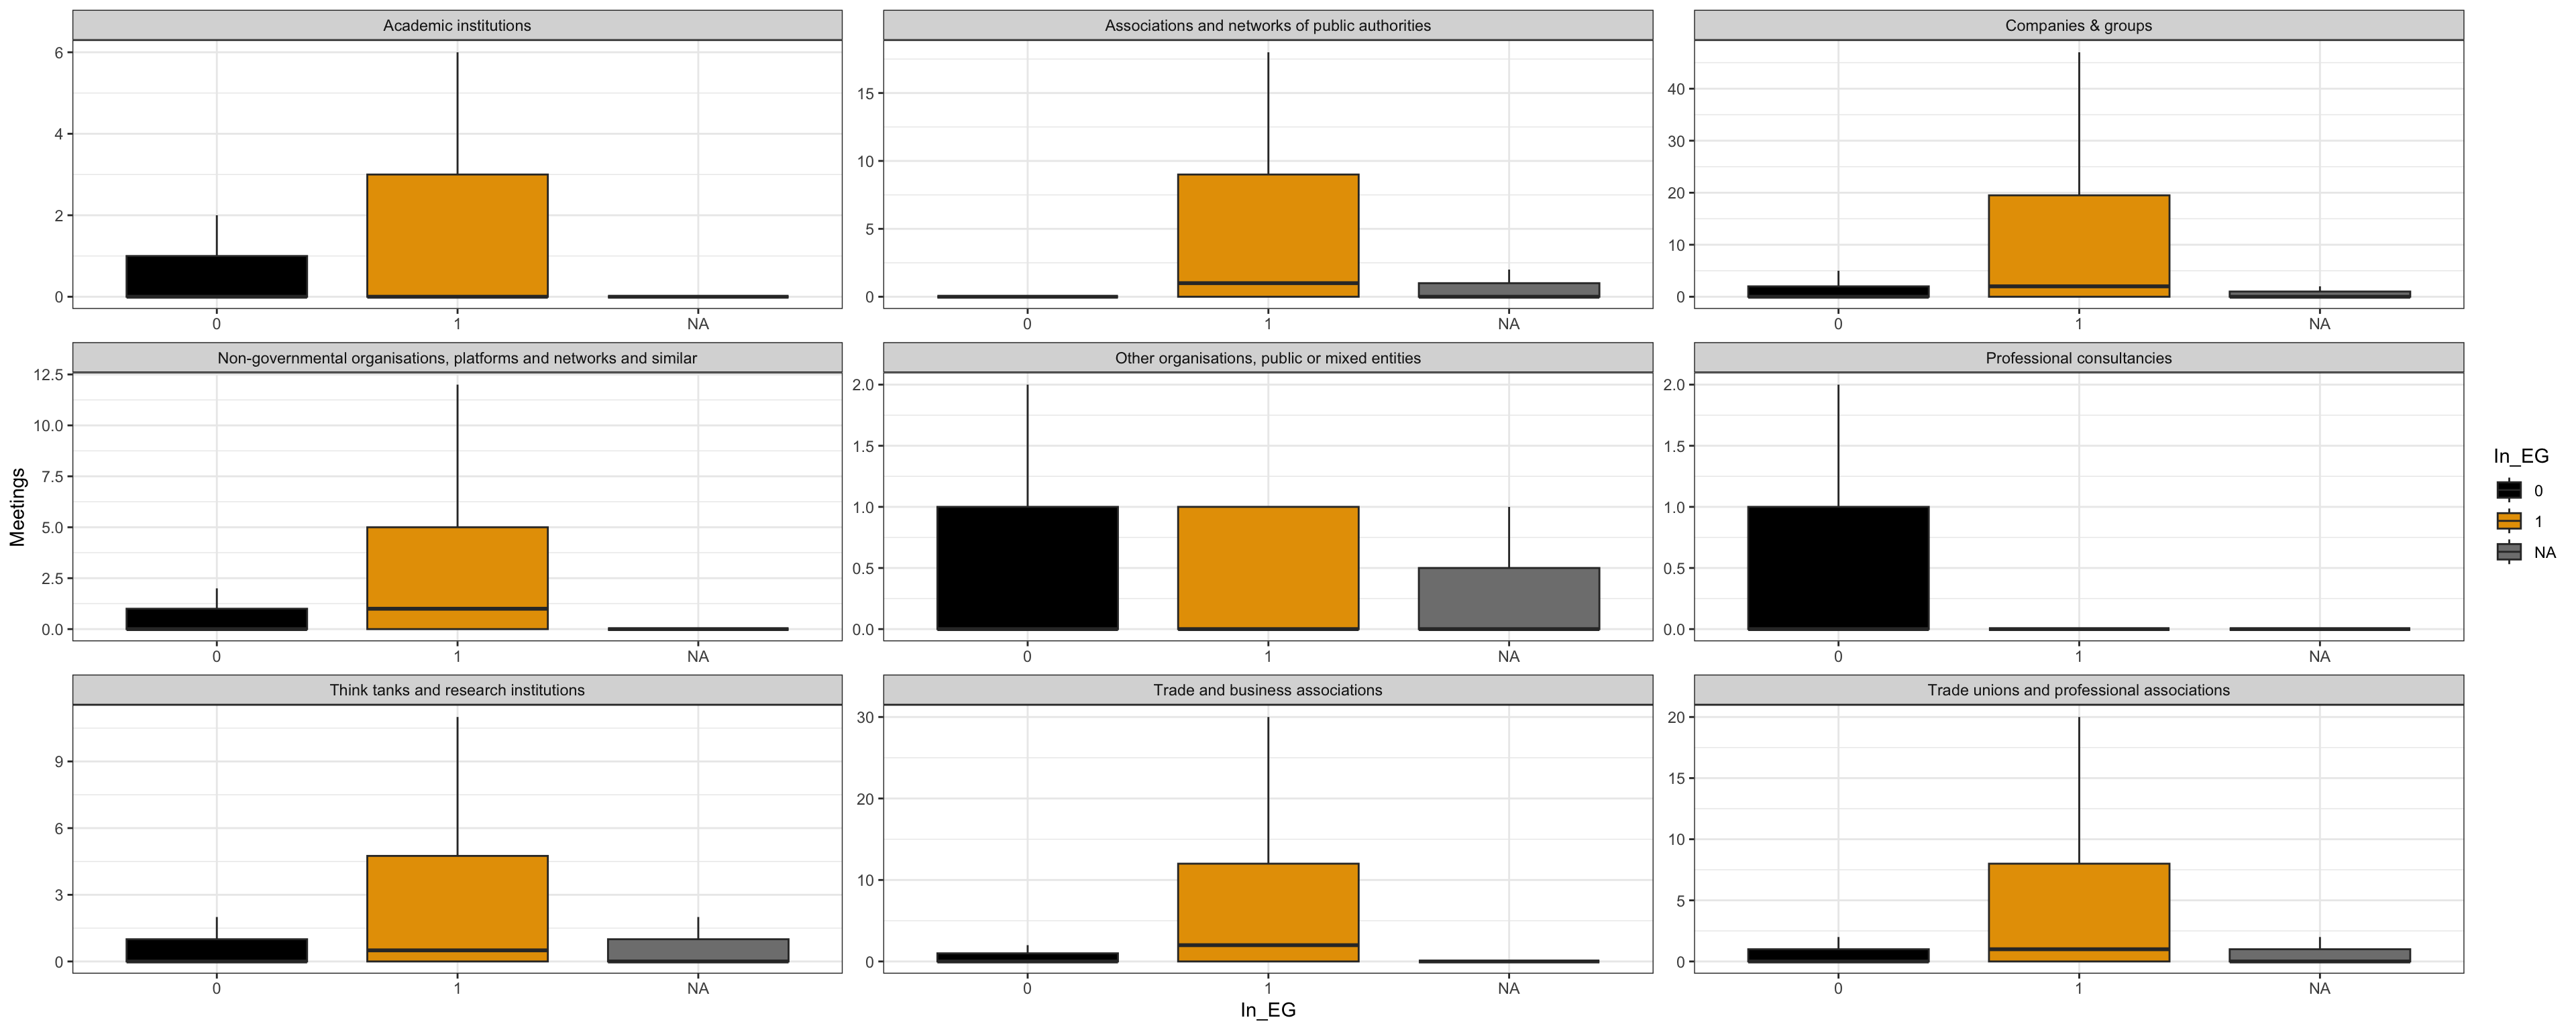
| Academic institutions | 0 (0 - 3) | 4 - 23 | 0.0 (0.0 - 1.0) | 2.0 - 17.0 | ||
| Associations and networks of public authorities | 1 (0 - 9) | 17 - 27 | 0.0 (0.0 - 0.0) | 2.0 - 22.0 | ||
| Companies & groups | 2 (0 - 20) | 49 - 372 | 0.0 (0.0 - 2.0) | 7.0 - 178.0 | ||
| Non-governmental organisations, platforms and networks and similar | 1 (0 - 5) | 19 - 291 | 0.0 (0.0 - 1.0) | 3.0 - 136.0 | ||
| Other organisations, public or mixed entities | 0 (0 - 1) | 13 - 81 | 0.0 (0.0 - 1.0) | 3.0 - 79.0 | ||
| Professional consultancies | 0 (0 - 0) | 19 - 22 | 0.0 (0.0 - 1.0) | 8.0 - 94.0 | ||
| Think tanks and research institutions | 1 (0 - 5) | 19 - 37 | 0.0 (0.0 - 1.0) | 6.0 - 95.0 | ||
| Trade and business associations | 2 (0 - 12) | 35 - 443 | 0.0 (0.0 - 1.0) | 4.0 - 93.0 | ||
| Trade unions and professional associations | 1 (0 - 8) | 20 - 252 | 0.0 (0.0 - 1.0) | 2.0 - 82.0 | ||
| 1 Meetings: Median (Q1 - Q3) | 90% Centile - Max | ||||
| 2 Kruskal-Wallis rank sum test | ||||
| Characteristic | N = 12,4421 |
|---|---|
| Category.of.registration | |
| Academic institutions | 2 (1 - 8) | 16 - 33 / 49 |
| Associations and networks of public authorities | 7 (2 - 17) | 33 - 79 / 39 |
| Companies & groups | 6 (2 - 16) | 40 - 218 / 1,013 |
| Non-governmental organisations, platforms and networks and similar | 6 (2 - 19) | 46 - 366 / 1,032 |
| Other organisations, public or mixed entities | 6 (2 - 16) | 39 - 238 / 95 |
| Professional consultancies | 11 (3 - 46) | 148 - 725 / 248 |
| Think tanks and research institutions | 7 (2 - 21) | 44 - 85 / 130 |
| Trade and business associations | 10 (3 - 28) | 55 - 318 / 902 |
| Trade unions and professional associations | 6 (2 - 21) | 47 - 168 / 249 |
| 1 all.EP.passes: Median (Q1 - Q3) | 90% Centile - Max / N Non-missing | |
Warning: Removed 8685 rows containing non-finite outside the scale range
(`stat_boxplot()`).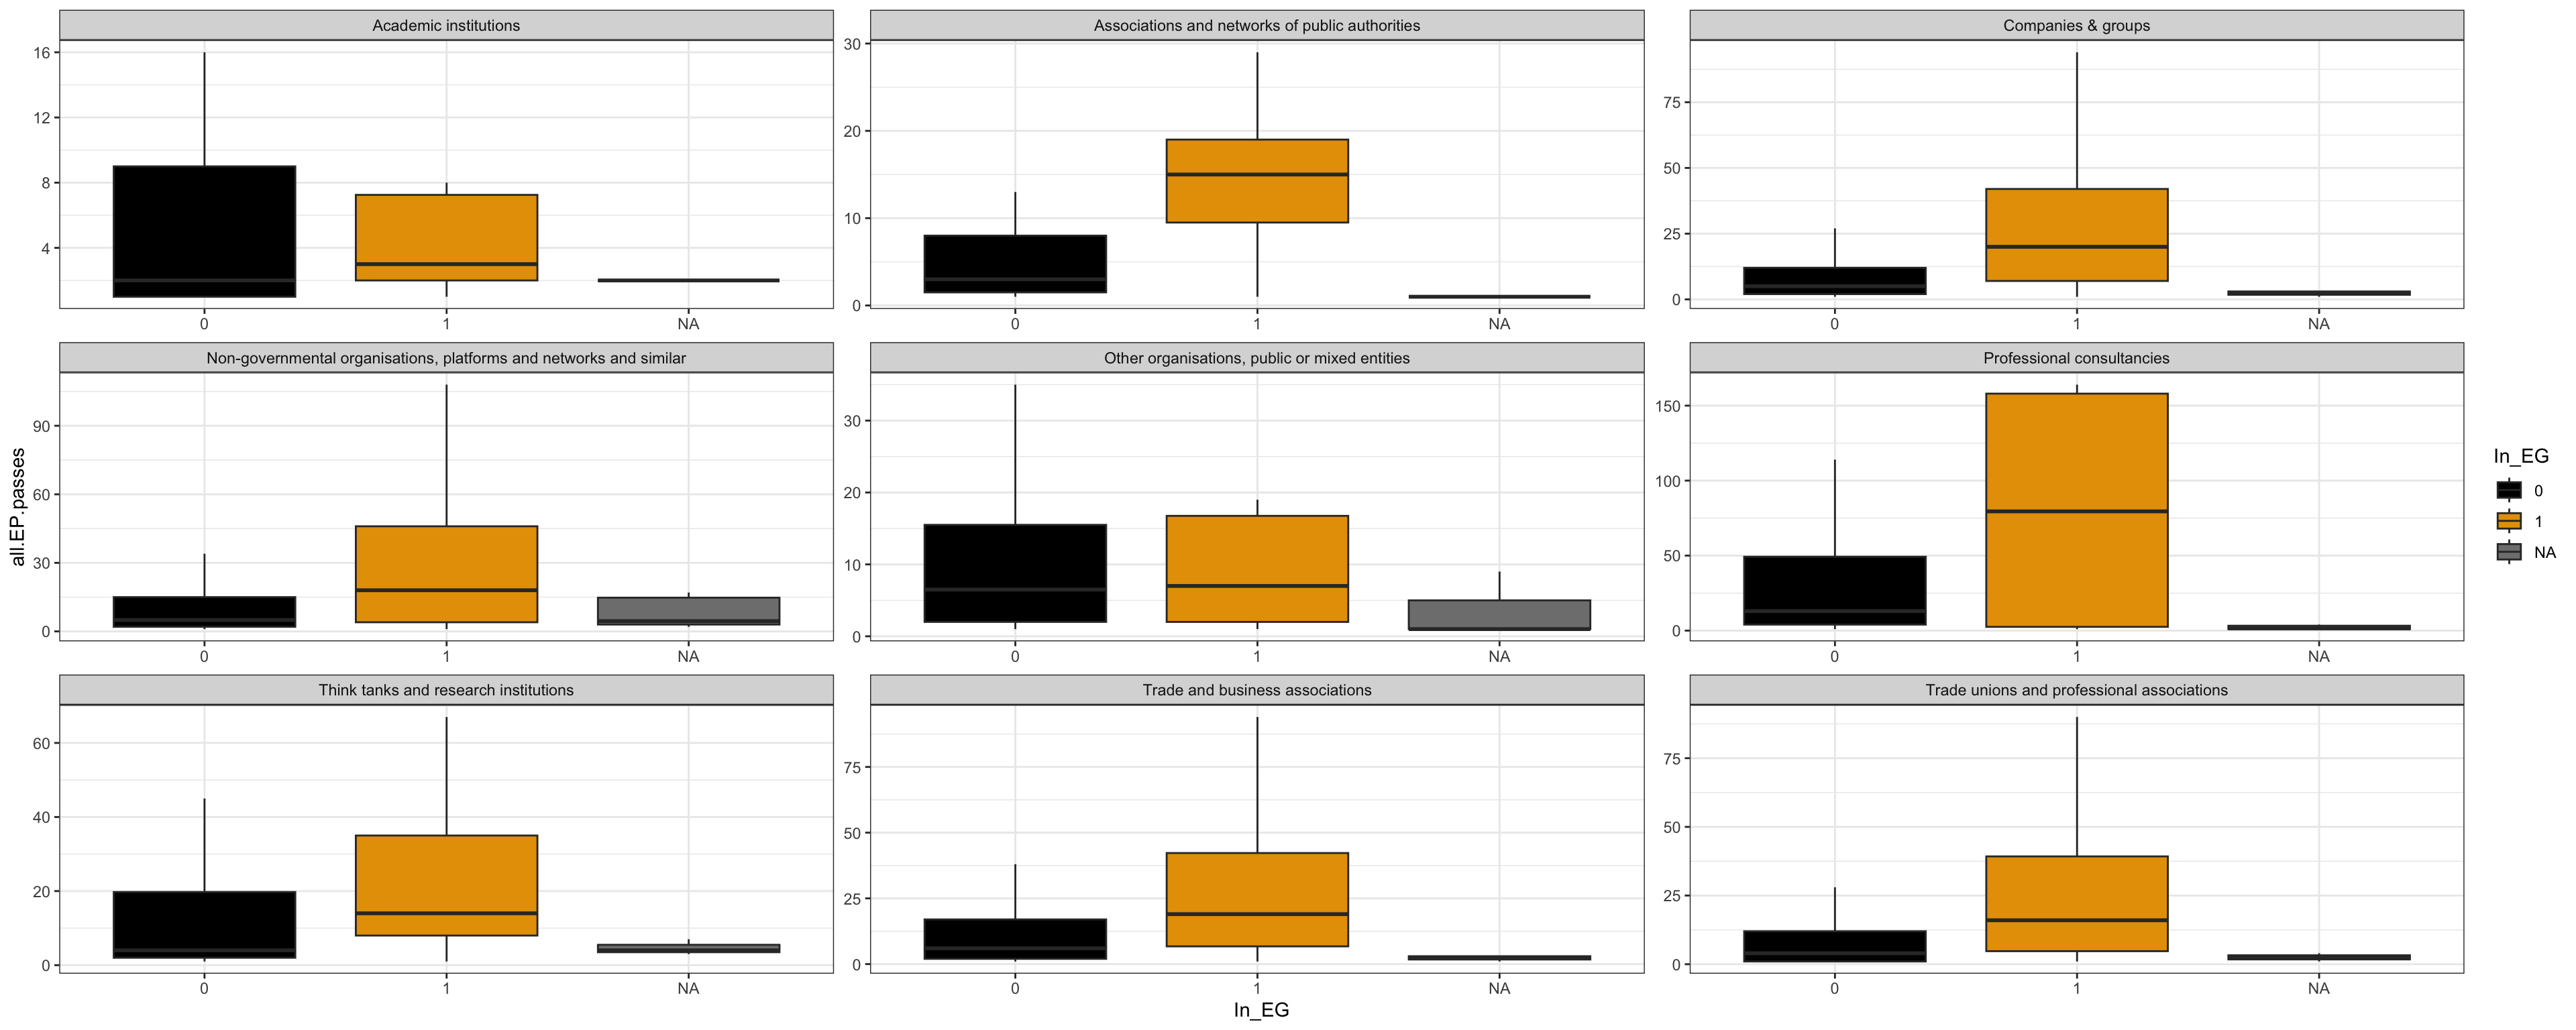
| Characteristic |
In_EG
|
No_EG
|
||
|---|---|---|---|---|
| N = 2,0991 | p-value2 | N = 9,8761 | p-value2 | |
| Category.of.registration | 0.043 | <0.001 | ||
| Academic institutions | 3 (2 - 8) | 21 - 33 / 12 | 2 (1 - 9) | 15 - 31 / 36 | ||
| Associations and networks of public authorities | 15 (7 - 21) | 71 - 79 / 15 | 3 (1 - 8) | 26 - 66 / 23 | ||
| Companies & groups | 20 (7 - 42) | 69 - 175 / 213 | 5 (2 - 12) | 27 - 218 / 788 | ||
| Non-governmental organisations, platforms and networks and similar | 18 (4 - 46) | 85 - 366 / 233 | 5 (2 - 15) | 34 - 156 / 789 | ||
| Other organisations, public or mixed entities | 7 (2 - 19) | 140 - 238 / 14 | 7 (2 - 16) | 38 - 90 / 78 | ||
| Professional consultancies | 80 (2 - 160) | 164 - 164 / 4 | 13 (4 - 50) | 143 - 725 / 232 | ||
| Think tanks and research institutions | 14 (8 - 35) | 60 - 67 / 29 | 4 (2 - 20) | 36 - 85 / 98 | ||
| Trade and business associations | 19 (7 - 43) | 74 - 318 / 404 | 6 (2 - 17) | 34 - 125 / 494 | ||
| Trade unions and professional associations | 16 (5 - 40) | 67 - 168 / 88 | 4 (1 - 12) | 31 - 77 / 157 | ||
| 1 all.EP.passes: Median (Q1 - Q3) | 90% Centile - Max / N Non-missing | ||||
| 2 Kruskal-Wallis rank sum test | ||||
| Characteristic | N = 12,4421 |
|---|---|
| Category.of.registration | |
| Academic institutions | 1.00 (0.00 - 2.00) | 4.00 - 15.00 / 322 |
| Associations and networks of public authorities | 0.00 (0.00 - 1.00) | 3.50 - 16.00 / 160 |
| Companies & groups | 0.00 (0.00 - 1.00) | 4.00 - 54.00 / 3,170 |
| Non-governmental organisations, platforms and networks and similar | 0.00 (0.00 - 1.00) | 4.00 - 91.00 / 3,411 |
| Other organisations, public or mixed entities | 0.00 (0.00 - 1.00) | 3.00 - 138.00 / 449 |
| Professional consultancies | 0.00 (0.00 - 0.00) | 1.00 - 17.00 / 463 |
| Think tanks and research institutions | 0.00 (0.00 - 1.00) | 3.00 - 25.00 / 541 |
| Trade and business associations | 1.00 (0.00 - 4.00) | 10.00 - 86.00 / 2,537 |
| Trade unions and professional associations | 0.00 (0.00 - 2.00) | 5.00 - 91.00 / 922 |
| 1 OPC: Median (Q1 - Q3) | 90% Centile - Max / N Non-missing | |
Warning: Removed 467 rows containing non-finite outside the scale range
(`stat_boxplot()`).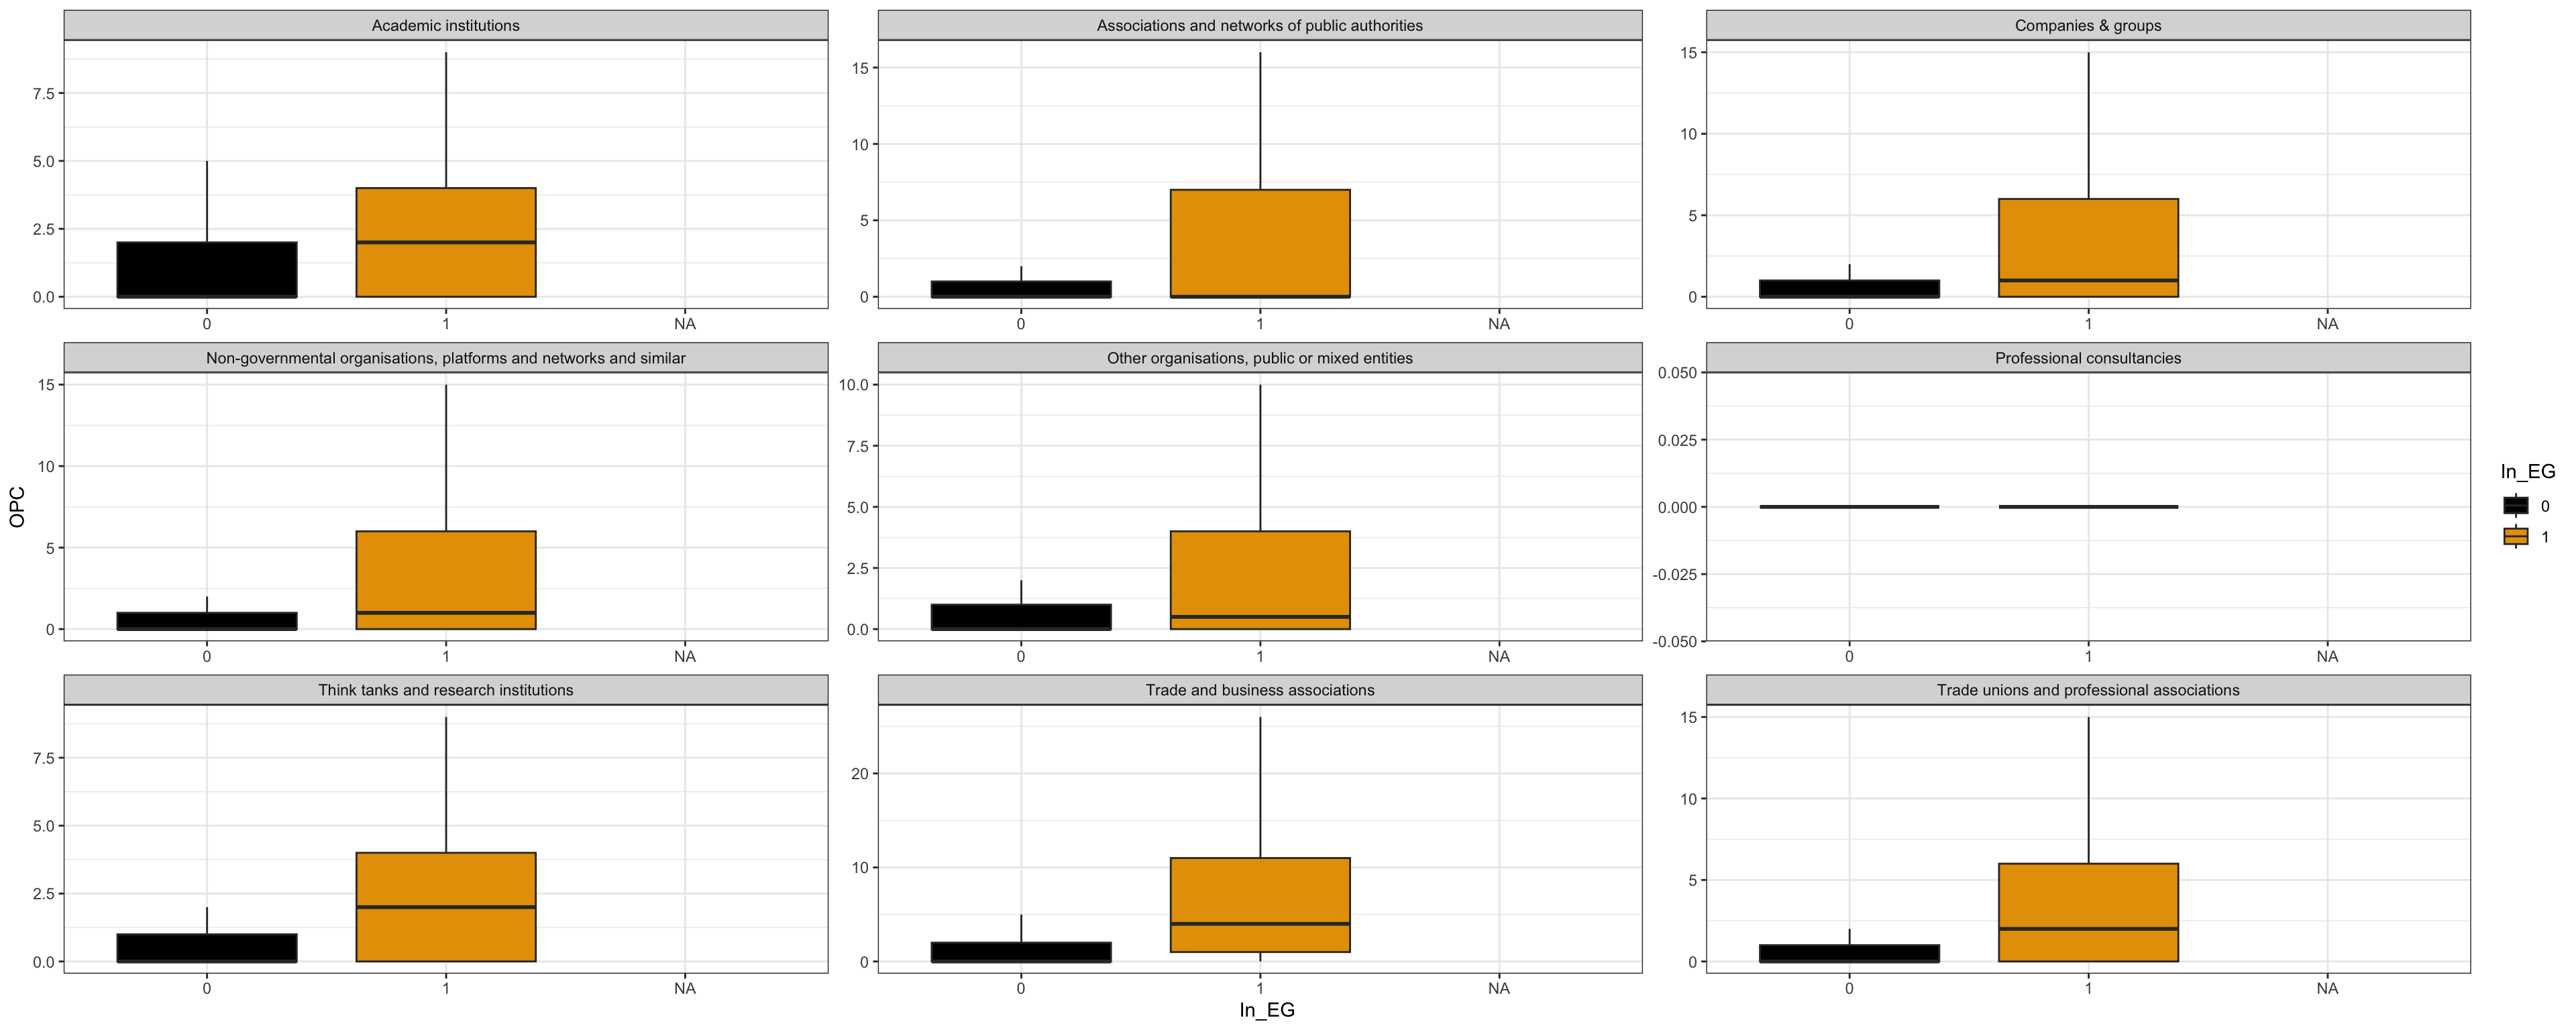
| Characteristic |
In_EG
|
No_EG
|
||
|---|---|---|---|---|
| N = 2,0991 | p-value2 | N = 9,8761 | p-value2 | |
| Category.of.registration | <0.001 | <0.001 | ||
| Academic institutions | 2 (0 - 4) | 5 - 15 / 67 | 0.00 (0.00 - 2.00) | 3.00 - 10.00 / 255 | ||
| Associations and networks of public authorities | 0 (0 - 7) | 12 - 16 / 29 | 0.00 (0.00 - 1.00) | 2.00 - 10.00 / 131 | ||
| Companies & groups | 1 (0 - 6) | 13 - 54 / 443 | 0.00 (0.00 - 1.00) | 3.00 - 43.00 / 2,727 | ||
| Non-governmental organisations, platforms and networks and similar | 1 (0 - 6) | 13 - 91 / 549 | 0.00 (0.00 - 1.00) | 3.00 - 41.00 / 2,862 | ||
| Other organisations, public or mixed entities | 1 (0 - 4) | 9 - 138 / 56 | 0.00 (0.00 - 1.00) | 2.00 - 13.00 / 393 | ||
| Professional consultancies | 0 (0 - 0) | 1 - 1 / 13 | 0.00 (0.00 - 0.00) | 1.00 - 17.00 / 450 | ||
| Think tanks and research institutions | 2 (0 - 4) | 11 - 21 / 90 | 0.00 (0.00 - 1.00) | 2.00 - 25.00 / 451 | ||
| Trade and business associations | 4 (1 - 11) | 22 - 86 / 663 | 0.00 (0.00 - 2.00) | 5.00 - 57.00 / 1,874 | ||
| Trade unions and professional associations | 2 (0 - 6) | 14 - 91 / 189 | 0.00 (0.00 - 1.00) | 3.00 - 33.00 / 733 | ||
| 1 OPC: Median (Q1 - Q3) | 90% Centile - Max / N Non-missing | ||||
| 2 Kruskal-Wallis rank sum test | ||||
| Characteristic | N = 12,4421 |
|---|---|
| Category.of.registration | |
| Academic institutions | 0.00 (0.00 - 0.00) | 1.00 - 10.00 / 322 |
| Associations and networks of public authorities | 0.00 (0.00 - 1.00) | 2.00 - 13.00 / 160 |
| Companies & groups | 0.00 (0.00 - 0.00) | 2.00 - 57.00 / 3,170 |
| Non-governmental organisations, platforms and networks and similar | 0.00 (0.00 - 1.00) | 3.00 - 93.00 / 3,411 |
| Other organisations, public or mixed entities | 0.00 (0.00 - 0.00) | 2.00 - 111.00 / 449 |
| Professional consultancies | 0.00 (0.00 - 0.00) | 0.00 - 21.00 / 463 |
| Think tanks and research institutions | 0.00 (0.00 - 0.00) | 2.00 - 24.00 / 541 |
| Trade and business associations | 0.00 (0.00 - 2.00) | 8.00 - 94.00 / 2,537 |
| Trade unions and professional associations | 0.00 (0.00 - 1.00) | 4.00 - 36.00 / 922 |
| 1 ROADMAPS: Median (Q1 - Q3) | 90% Centile - Max / N Non-missing | |
Warning: Removed 467 rows containing non-finite outside the scale range
(`stat_boxplot()`).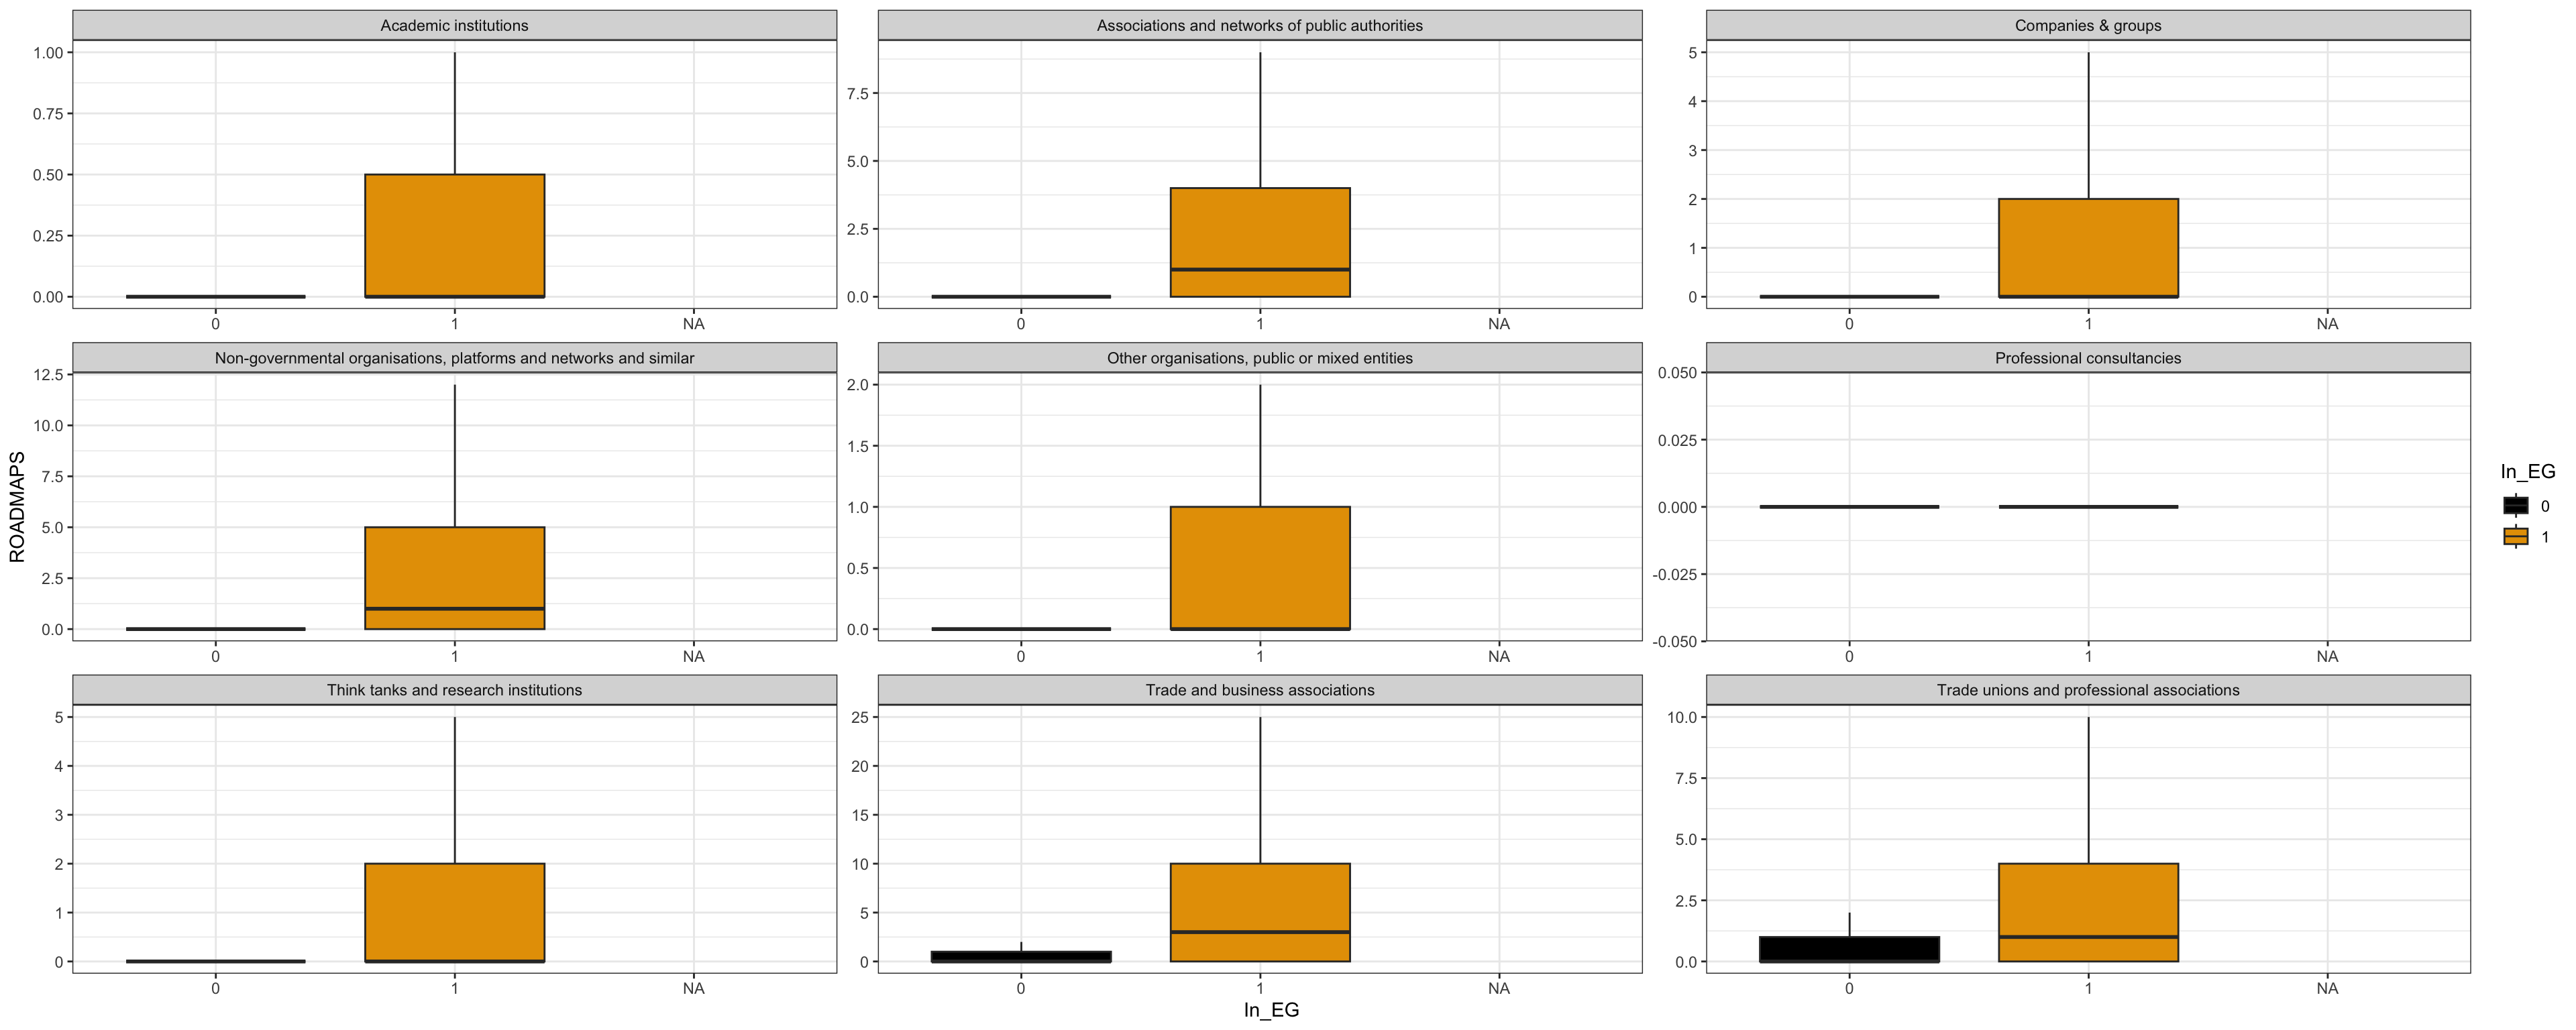
| Characteristic |
In_EG
|
No_EG
|
||
|---|---|---|---|---|
| N = 2,0991 | p-value2 | N = 9,8761 | p-value2 | |
| Category.of.registration | <0.001 | <0.001 | ||
| Academic institutions | 0 (0 - 1) | 2 - 5 / 67 | 0.00 (0.00 - 0.00) | 1.00 - 10.00 / 255 | ||
| Associations and networks of public authorities | 1 (0 - 4) | 9 - 13 / 29 | 0.00 (0.00 - 0.00) | 1.00 - 5.00 / 131 | ||
| Companies & groups | 0 (0 - 2) | 7 - 57 / 443 | 0.00 (0.00 - 0.00) | 1.00 - 30.00 / 2,727 | ||
| Non-governmental organisations, platforms and networks and similar | 1 (0 - 5) | 13 - 93 / 549 | 0.00 (0.00 - 0.00) | 2.00 - 72.00 / 2,862 | ||
| Other organisations, public or mixed entities | 0 (0 - 1) | 5 - 111 / 56 | 0.00 (0.00 - 0.00) | 2.00 - 72.00 / 393 | ||
| Professional consultancies | 0 (0 - 0) | 1 - 1 / 13 | 0.00 (0.00 - 0.00) | 0.00 - 21.00 / 450 | ||
| Think tanks and research institutions | 0 (0 - 2) | 7 - 24 / 90 | 0.00 (0.00 - 0.00) | 1.00 - 14.00 / 451 | ||
| Trade and business associations | 3 (0 - 10) | 19 - 94 / 663 | 0.00 (0.00 - 1.00) | 3.00 - 44.00 / 1,874 | ||
| Trade unions and professional associations | 1 (0 - 4) | 11 - 36 / 189 | 0.00 (0.00 - 1.00) | 2.00 - 19.00 / 733 | ||
| 1 ROADMAPS: Median (Q1 - Q3) | 90% Centile - Max / N Non-missing | ||||
| 2 Kruskal-Wallis rank sum test | ||||
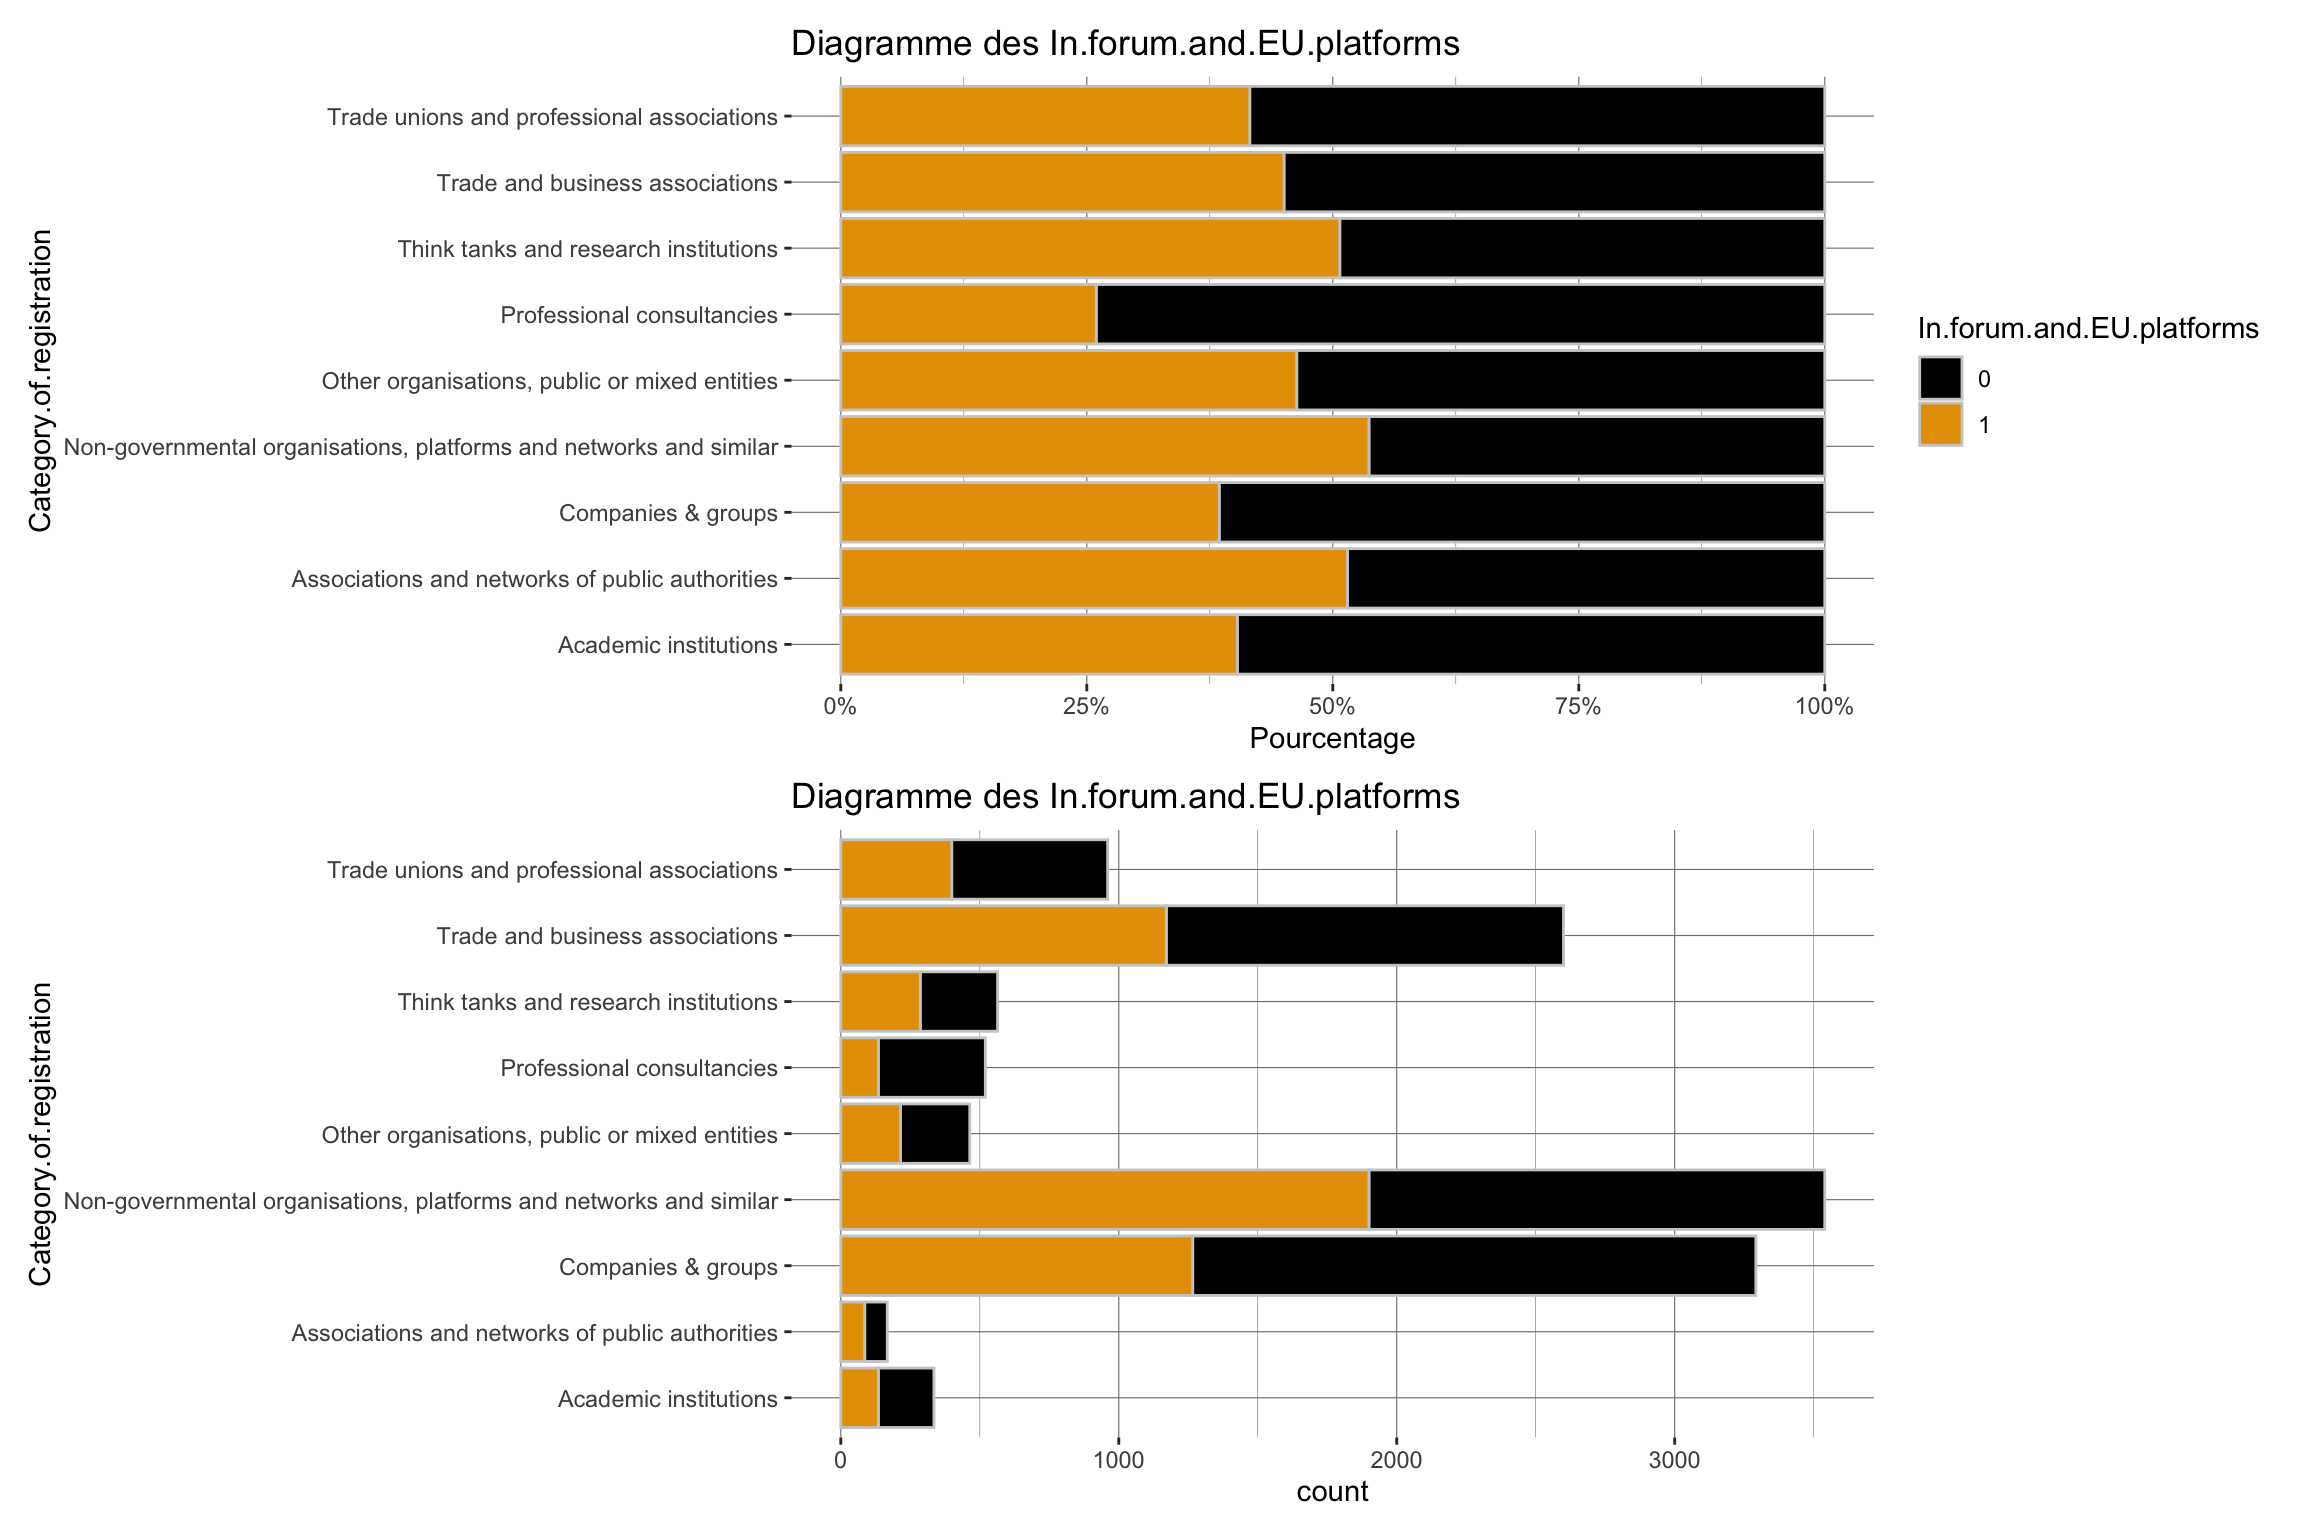
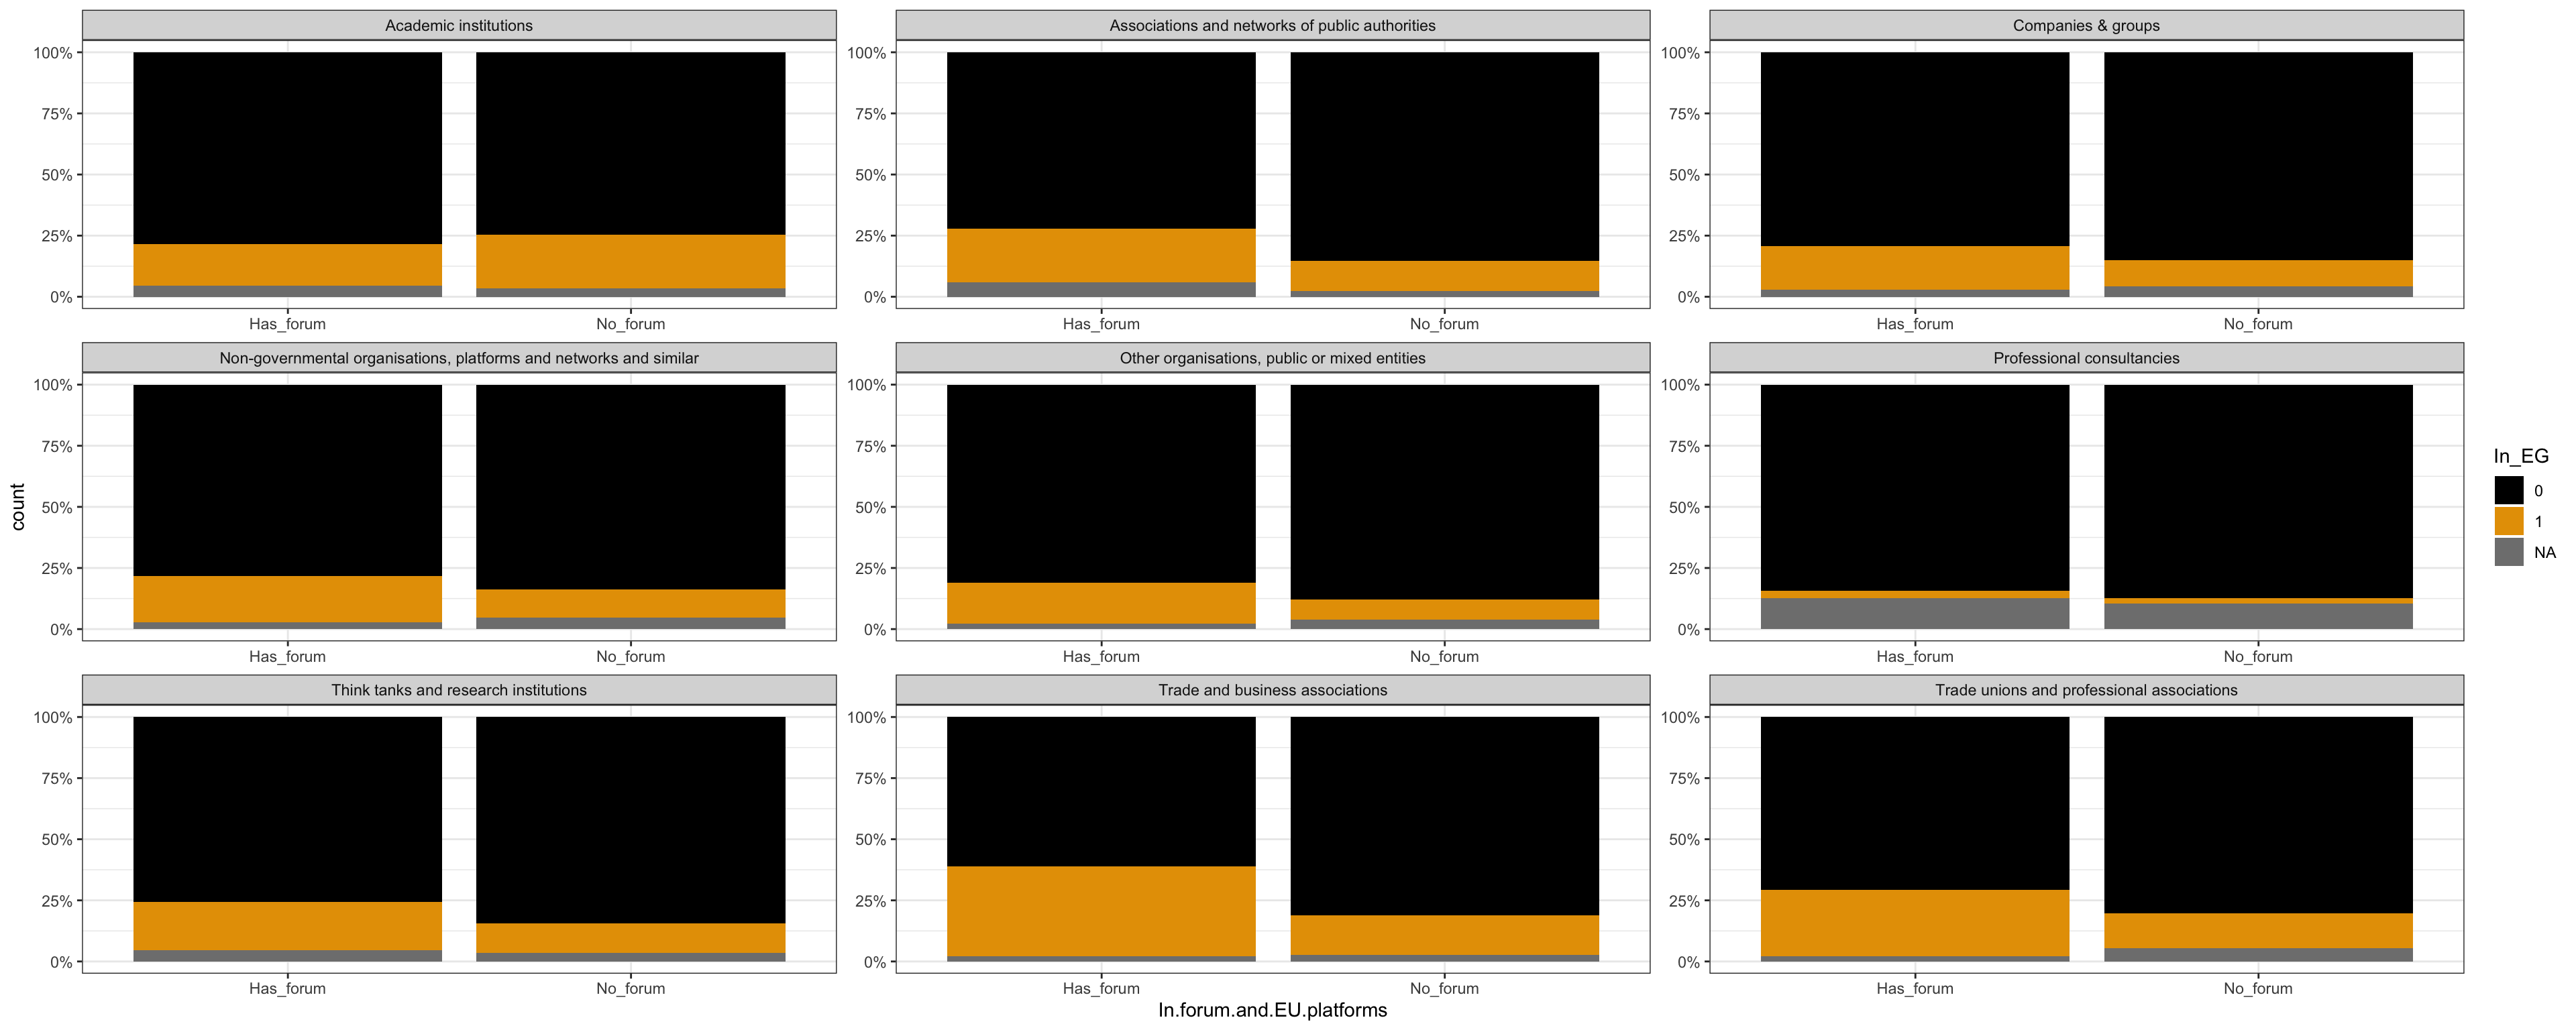
| Characteristic | Has_forum N = 5,5931 |
No_forum N = 6,8491 |
p-value2 |
|---|---|---|---|
| Category.of.registration | <0.001 | ||
| Academic institutions | 135 (2.4%) | 200 (2.9%) | |
| Associations and networks of public authorities | 86 (1.5%) | 81 (1.2%) | |
| Companies & groups | 1,266 (23%) | 2,026 (30%) | |
| Non-governmental organisations, platforms and networks and similar | 1,900 (34%) | 1,640 (24%) | |
| Other organisations, public or mixed entities | 215 (3.8%) | 249 (3.6%) | |
| Professional consultancies | 135 (2.4%) | 385 (5.6%) | |
| Think tanks and research institutions | 286 (5.1%) | 278 (4.1%) | |
| Trade and business associations | 1,171 (21%) | 1,429 (21%) | |
| Trade unions and professional associations | 399 (7.1%) | 561 (8.2%) | |
| 1 n (%) | |||
| 2 Pearson’s Chi-squared test | |||
| Characteristic |
In_EG
|
No_EG
|
||||
|---|---|---|---|---|---|---|
| Has_forum N = 1,2621 |
No_forum N = 8371 |
p-value2 | Has_forum N = 4,1631 |
No_forum N = 5,7131 |
p-value2 | |
| Category.of.registration | <0.001 | <0.001 | ||||
| Academic institutions | 23 (1.8%) | 44 (5.3%) | 106 (2.5%) | 149 (2.6%) | ||
| Associations and networks of public authorities | 19 (1.5%) | 10 (1.2%) | 62 (1.5%) | 69 (1.2%) | ||
| Companies & groups | 225 (18%) | 218 (26%) | 1,005 (24%) | 1,722 (30%) | ||
| Non-governmental organisations, platforms and networks and similar | 358 (28%) | 191 (23%) | 1,489 (36%) | 1,373 (24%) | ||
| Other organisations, public or mixed entities | 36 (2.9%) | 20 (2.4%) | 174 (4.2%) | 219 (3.8%) | ||
| Professional consultancies | 4 (0.3%) | 9 (1.1%) | 114 (2.7%) | 336 (5.9%) | ||
| Think tanks and research institutions | 57 (4.5%) | 33 (3.9%) | 216 (5.2%) | 235 (4.1%) | ||
| Trade and business associations | 431 (34%) | 232 (28%) | 715 (17%) | 1,159 (20%) | ||
| Trade unions and professional associations | 109 (8.6%) | 80 (9.6%) | 282 (6.8%) | 451 (7.9%) | ||
| 1 n (%) | ||||||
| 2 Pearson’s Chi-squared test | ||||||
Resized limits to included dashed line in forest panel`height` was translated to `width`.
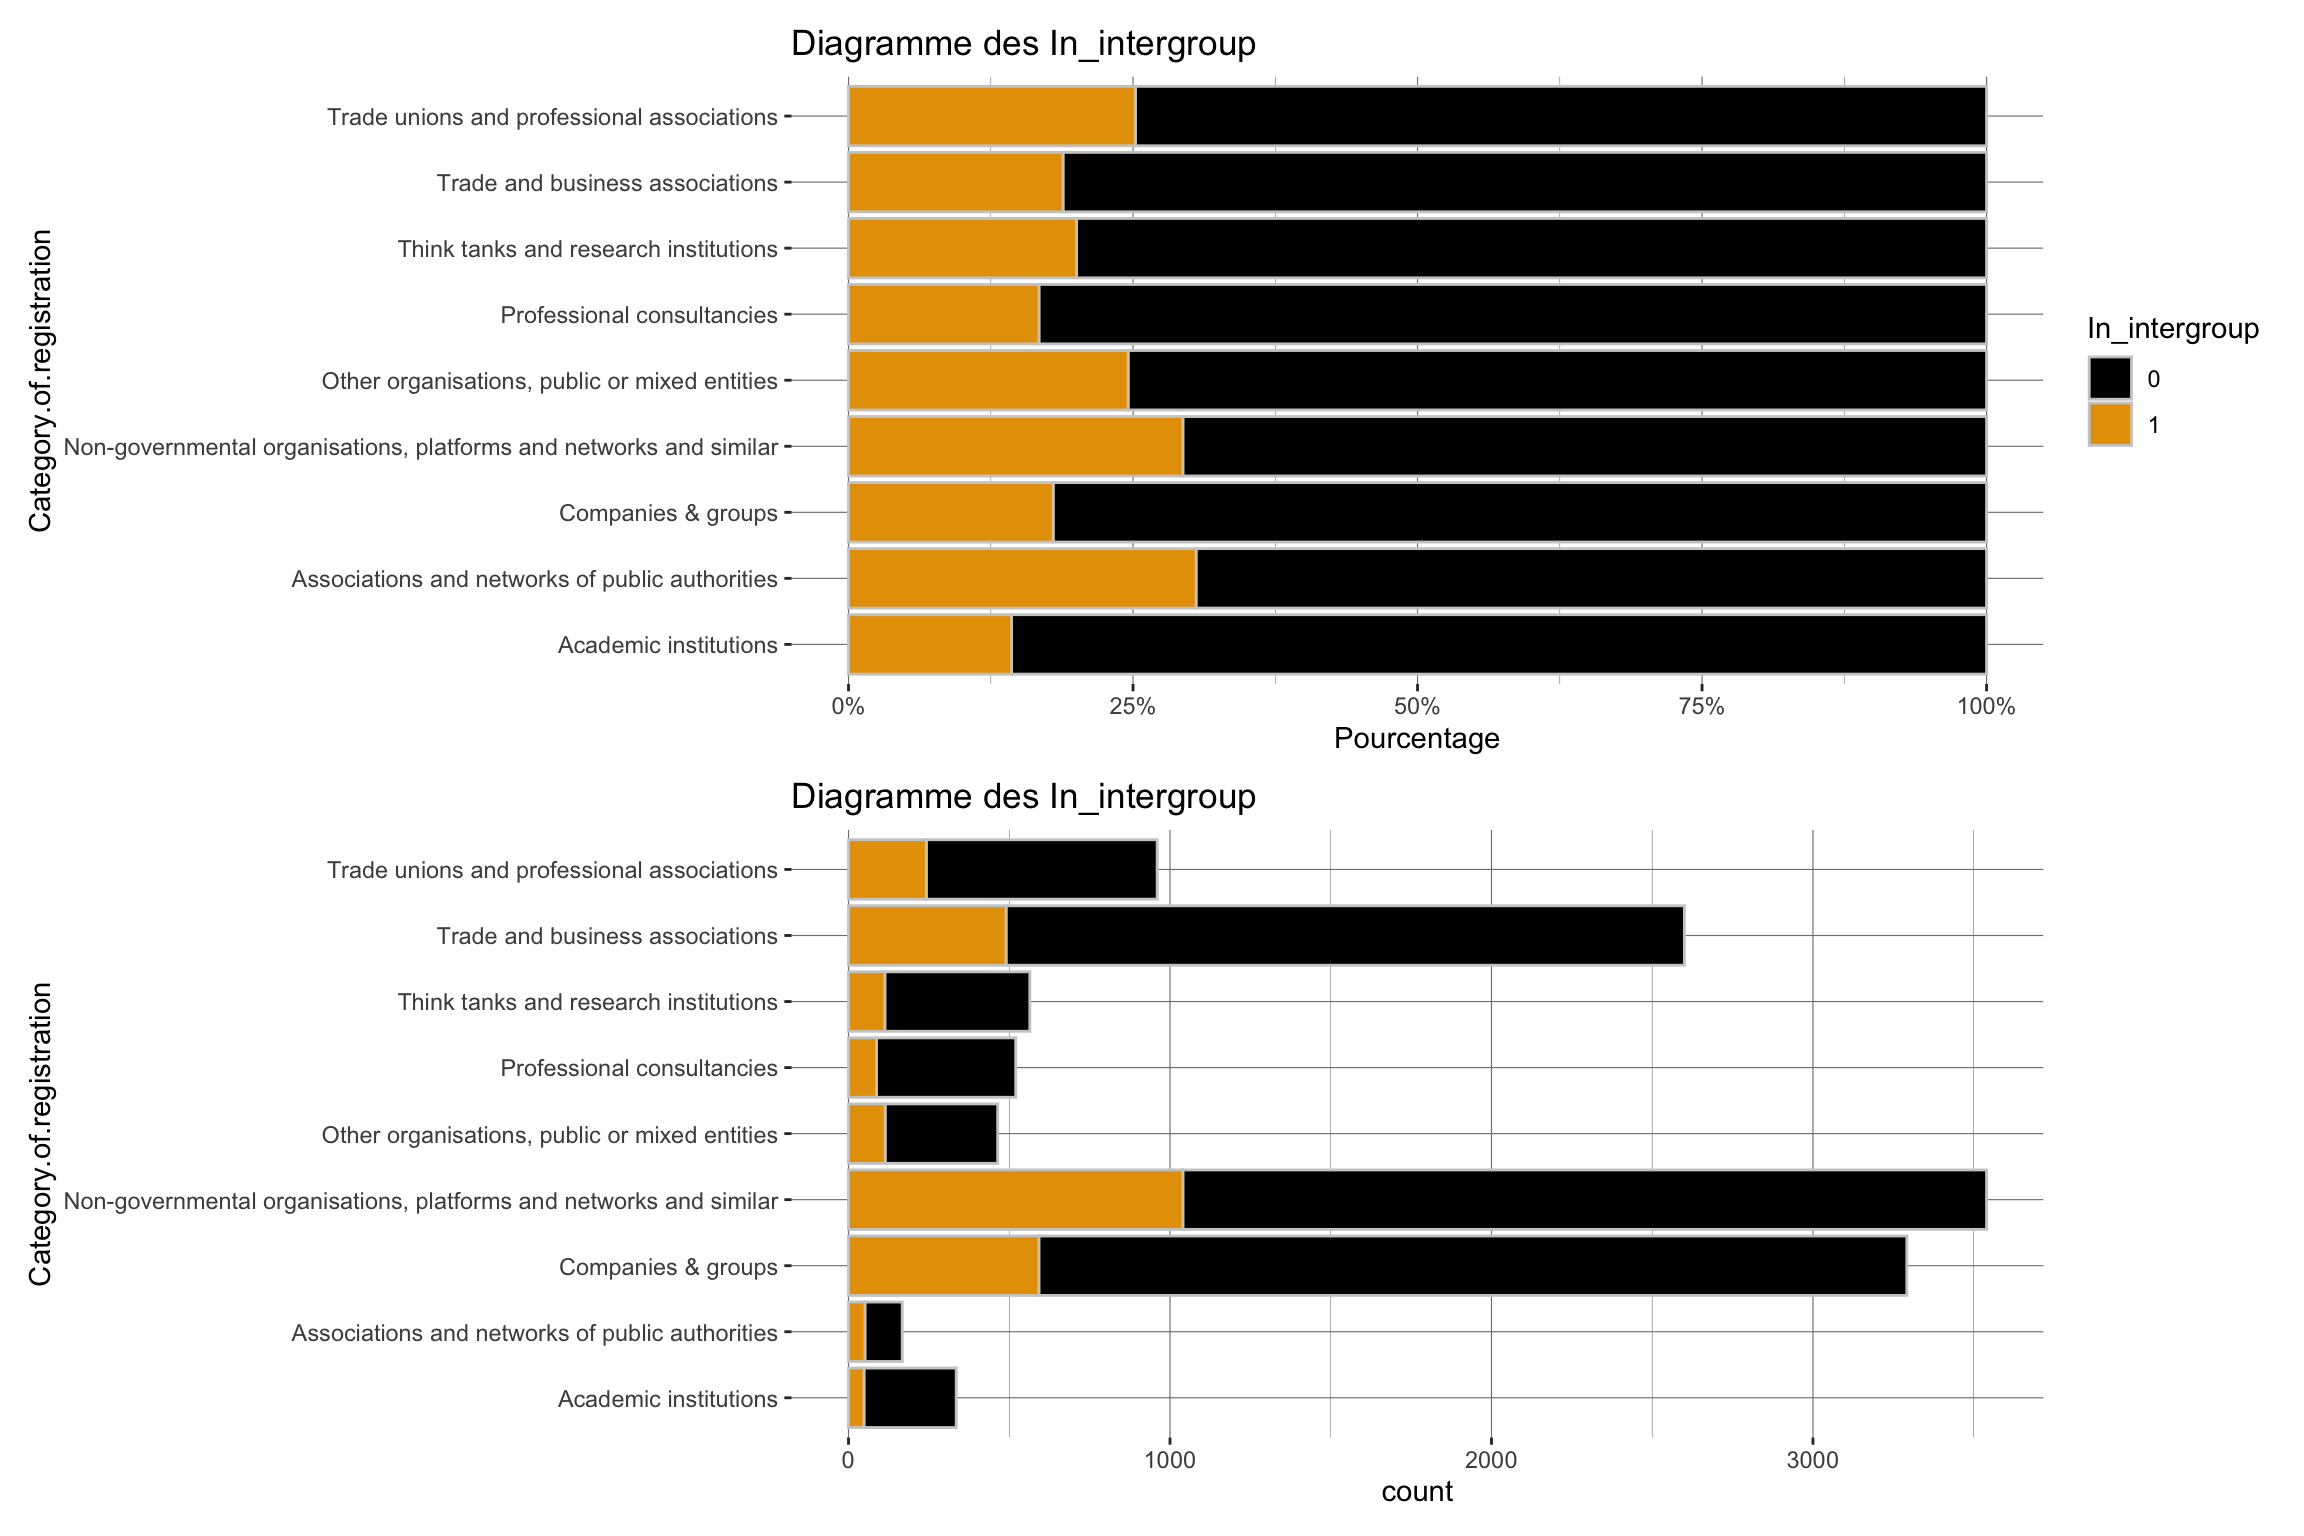
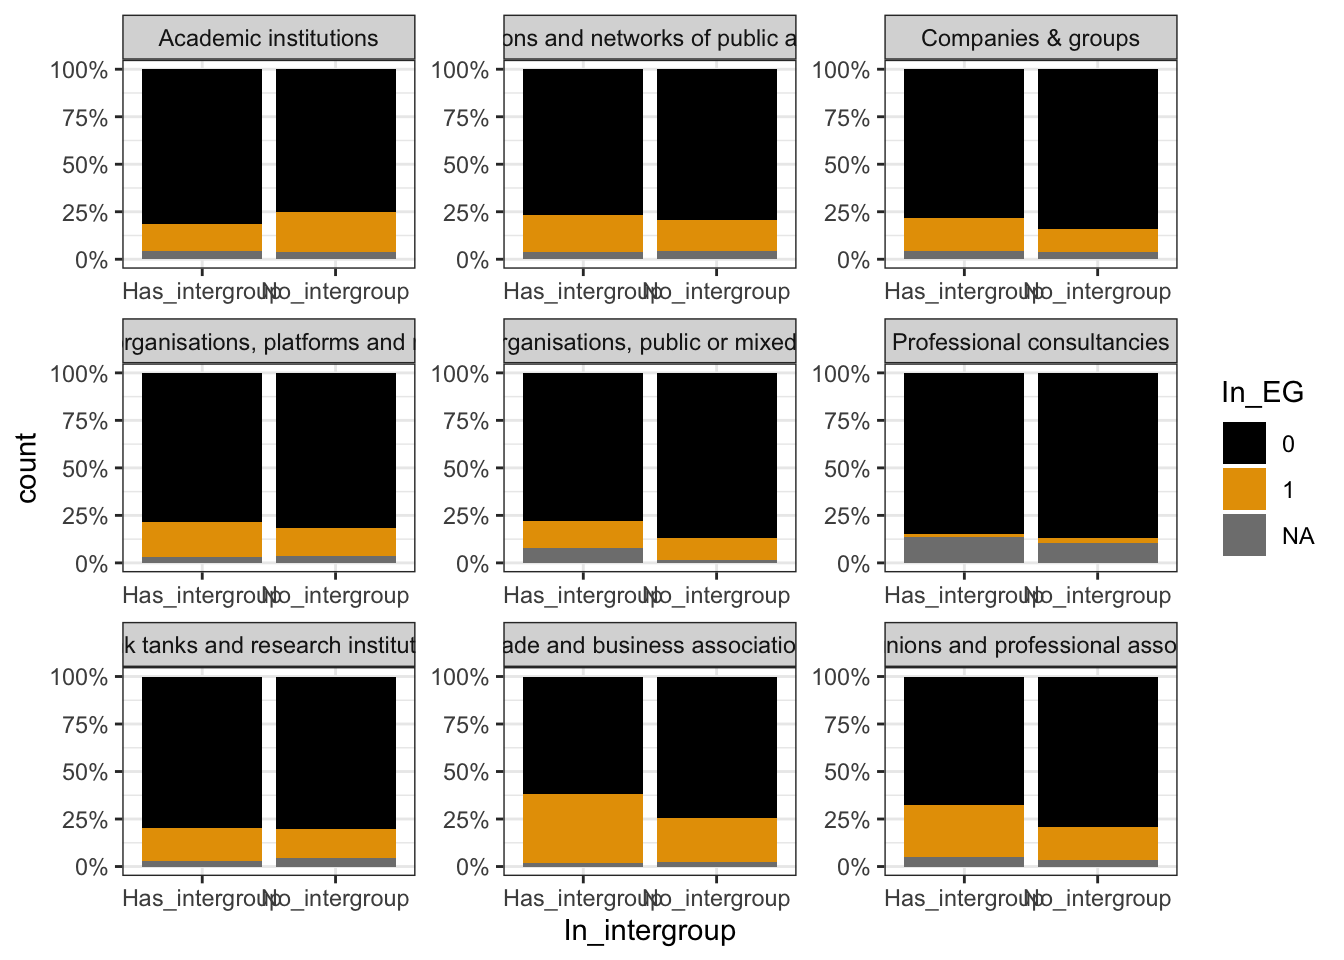
| Characteristic | Has_intergroup N = 2,7771 |
No_intergroup N = 9,6651 |
p-value2 |
|---|---|---|---|
| Category.of.registration | <0.001 | ||
| Academic institutions | 48 (1.7%) | 287 (3.0%) | |
| Associations and networks of public authorities | 51 (1.8%) | 116 (1.2%) | |
| Companies & groups | 592 (21%) | 2,700 (28%) | |
| Non-governmental organisations, platforms and networks and similar | 1,040 (37%) | 2,500 (26%) | |
| Other organisations, public or mixed entities | 114 (4.1%) | 350 (3.6%) | |
| Professional consultancies | 87 (3.1%) | 433 (4.5%) | |
| Think tanks and research institutions | 113 (4.1%) | 451 (4.7%) | |
| Trade and business associations | 490 (18%) | 2,110 (22%) | |
| Trade unions and professional associations | 242 (8.7%) | 718 (7.4%) | |
| 1 n (%) | |||
| 2 Pearson’s Chi-squared test | |||
The following errors were returned during `tbl_strata()`:
✖ For variable `Category.of.registration` (`In_intergroup`) and "estimate",
  "p.value", "conf.low", and "conf.high" statistics: FEXACT erreur 7(location).
  LDSTP=18270 est trop petit pour ce problème, (pastp=87.1375,
  ipn_0:=ipoin[itp=261]=3697, stp[ipn_0]=81.8651). Augmentez la taille de
  l’environnement de travail ou considérez l’utilisation de
‘simulate.p.value=TRUE’.| Characteristic |
In_EG
|
No_EG
|
||||
|---|---|---|---|---|---|---|
| Has_intergroup N = 5891 |
No_intergroup N = 1,5101 |
p-value | Has_intergroup N = 2,0791 |
No_intergroup N = 7,7971 |
p-value2 | |
| Category.of.registration | <0.001 | |||||
| Academic institutions | 7 (1.2%) | 60 (4.0%) | 39 (1.9%) | 216 (2.8%) | ||
| Associations and networks of public authorities | 10 (1.7%) | 19 (1.3%) | 39 (1.9%) | 92 (1.2%) | ||
| Companies & groups | 103 (17%) | 340 (23%) | 463 (22%) | 2,264 (29%) | ||
| Non-governmental organisations, platforms and networks and similar | 189 (32%) | 360 (24%) | 818 (39%) | 2,044 (26%) | ||
| Other organisations, public or mixed entities | 16 (2.7%) | 40 (2.6%) | 89 (4.3%) | 304 (3.9%) | ||
| Professional consultancies | 1 (0.2%) | 12 (0.8%) | 74 (3.6%) | 376 (4.8%) | ||
| Think tanks and research institutions | 20 (3.4%) | 70 (4.6%) | 90 (4.3%) | 361 (4.6%) | ||
| Trade and business associations | 177 (30%) | 486 (32%) | 303 (15%) | 1,571 (20%) | ||
| Trade unions and professional associations | 66 (11%) | 123 (8.1%) | 164 (7.9%) | 569 (7.3%) | ||
| 1 n (%) | ||||||
| 2 Pearson’s Chi-squared test | ||||||
Resized limits to included dashed line in forest panel`height` was translated to `width`.