Attachement du package : 'dplyr'Les objets suivants sont masqués depuis 'package:stats':
filter, lagLes objets suivants sont masqués depuis 'package:base':
intersect, setdiff, setequal, unionNous utilisons le registre de transparence de l’Union Européenne pour observer les caractéristiques des groupes d’intérêts qui interviennent auprès de la Commissions Européennes, et en particulier pour observer les différences entre les groupes qui sont dans des groupes d’intérêts et ceux qui ne le sont pas.
Commençons tout d’abord par détailler les données :
Nous nous appuyons sur les données publiées par l’Union Européenne à cette adresse : https://data.europa.eu/data/datasets/transparency-register?locale=en
On utilise aussi en parallèle les données nettoyées par LobbyFacts, qui permet de nettoyer des informations sur le nombre de temps pleins et sur les budgets : https://www.lobbyfacts.eu/
Attachement du package : 'dplyr'Les objets suivants sont masqués depuis 'package:stats':
filter, lagLes objets suivants sont masqués depuis 'package:base':
intersect, setdiff, setequal, union| Ressources par catégorie | ||||||||||||||||
| En 2019 - Pourcentage ligne | ||||||||||||||||
| Characteristic | Academic institutions N = 3341 |
Companies & groups N = 2,3401 |
Law firms N = 1141 |
Non-governmental organisations, platforms and networks and similar N = 3,1711 |
Organisations representing churches and religious communities N = 531 |
Other organisations N = 3141 |
Other public or mixed entities, created by law whose purpose is to act in the public interest N = 2791 |
Other sub-national public authorities N = 1011 |
Professional consultancies N = 6631 |
Regional structures N = 1111 |
Self-employed consultants N = 3181 |
Think tanks and research institutions N = 5871 |
Trade and business associations N = 2,4501 |
Trade unions and professional associations N = 9091 |
Transnational associations and networks of public regional or other sub-national authorities N = 861 |
Overall N = 11,8301 |
|---|---|---|---|---|---|---|---|---|---|---|---|---|---|---|---|---|
| Members | 3.0 (1.0, 8.0) - max = 86.0) | 2.0 (1.0, 4.0) - max = 45.0) | 2.0 (1.0, 4.0) - max = 25.0) | 3.0 (1.0, 5.0) - max = 100.0) | 2.0 (2.0, 5.0) - max = 11.0) | 2.0 (1.0, 4.0) - max = 25.0) | 3.0 (1.0, 5.0) - max = 50.0) | 3.0 (1.0, 6.0) - max = 80.0) | 2.0 (1.0, 4.0) - max = 60.0) | 3.0 (2.0, 6.0) - max = 46.0) | 1.0 (1.0, 1.0) - max = 11.0) | 4.0 (2.0, 8.0) - max = 165.0) | 2.0 (1.0, 4.0) - max = 84.0) | 2.0 (1.0, 4.0) - max = 30.0) | 3.0 (1.0, 5.0) - max = 32.0) | 2.0 (1.0, 5.0) - max = 165.0) |
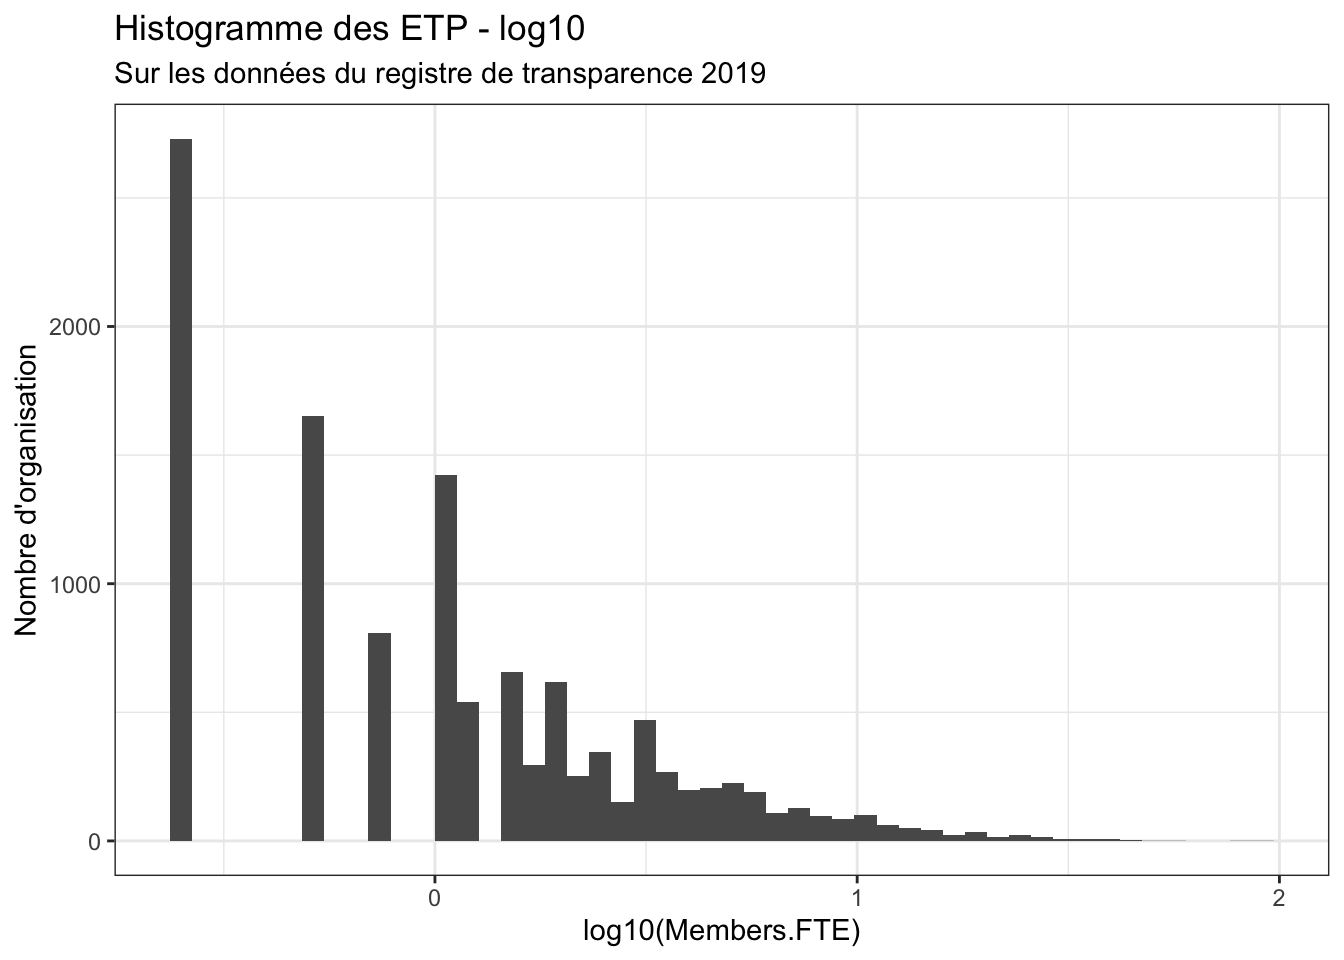
| Members.FTE | 1.00 (0.50, 3.00) - max = 86.00) | 0.75 (0.25, 1.75) - max = 45.00) | 0.75 (0.25, 1.50) - max = 11.50) | 1.00 (0.50, 2.75) - max = 54.00) | 1.00 (0.75, 2.50) - max = 7.50) | 1.00 (0.50, 2.00) - max = 15.25) | 1.00 (0.50, 3.00) - max = 39.00) | 2.00 (0.50, 5.00) - max = 43.75) | 1.00 (0.50, 2.75) - max = 41.25) | 2.50 (1.00, 5.00) - max = 23.00) | 0.75 (0.25, 1.00) - max = 9.75) | 1.50 (0.50, 4.00) - max = 91.50) | 1.00 (0.50, 2.00) - max = 49.00) | 1.00 (0.25, 2.00) - max = 22.25) | 1.50 (0.50, 3.50) - max = 11.25) | 1.00 (0.50, 2.25) - max = 91.50) |
| Number.of.EP.accredited.persons | 1.00 (1.00, 3.00) - max = 6.00) | 2.00 (1.00, 3.00) - max = 21.00) | 3.00 (1.00, 5.00) - max = 9.00) | 2.00 (1.00, 4.00) - max = 26.00) | 2.00 (1.00, 4.00) - max = 6.00) | 2.00 (1.00, 2.00) - max = 13.00) | 2.00 (1.00, 3.00) - max = 5.00) | 3.00 (1.00, 4.00) - max = 6.00) | 2.00 (1.00, 6.00) - max = 58.00) | 4.00 (1.50, 5.00) - max = 12.00) | 1.00 (1.00, 1.00) - max = 2.00) | 2.00 (1.00, 4.00) - max = 9.00) | 2.00 (1.00, 3.00) - max = 24.00) | 2.00 (1.00, 3.00) - max = 14.00) | 2.00 (1.00, 2.00) - max = 4.00) | 2.00 (1.00, 3.00) - max = 58.00) |
| Unknown | 310 | 1,841 | 91 | 2,582 | 29 | 269 | 256 | 94 | 469 | 103 | 245 | 498 | 1,901 | 782 | 69 | 9,539 |
| Bruxel | ||||||||||||||||
| 0 | 294 (3.5%) | 1,834 (22%) | 59 (0.7%) | 2,285 (27%) | 22 (0.3%) | 228 (2.7%) | 224 (2.7%) | 63 (0.7%) | 418 (5.0%) | 61 (0.7%) | 233 (2.8%) | 444 (5.3%) | 1,528 (18%) | 673 (8.0%) | 56 (0.7%) | 8,422 (100%) |
| 1 | 40 (1.2%) | 506 (15%) | 55 (1.6%) | 886 (26%) | 31 (0.9%) | 86 (2.5%) | 55 (1.6%) | 38 (1.1%) | 245 (7.2%) | 50 (1.5%) | 85 (2.5%) | 143 (4.2%) | 922 (27%) | 236 (6.9%) | 30 (0.9%) | 3,408 (100%) |
| In_intergroup | ||||||||||||||||
| 0 | 324 (2.9%) | 2,251 (20%) | 113 (1.0%) | 2,865 (26%) | 42 (0.4%) | 300 (2.7%) | 268 (2.4%) | 93 (0.8%) | 631 (5.7%) | 101 (0.9%) | 298 (2.7%) | 558 (5.1%) | 2,268 (21%) | 844 (7.7%) | 70 (0.6%) | 11,026 (100%) |
| 1 | 10 (1.2%) | 89 (11%) | 1 (0.1%) | 306 (38%) | 11 (1.4%) | 14 (1.7%) | 11 (1.4%) | 8 (1.0%) | 32 (4.0%) | 10 (1.2%) | 20 (2.5%) | 29 (3.6%) | 182 (23%) | 65 (8.1%) | 16 (2.0%) | 804 (100%) |
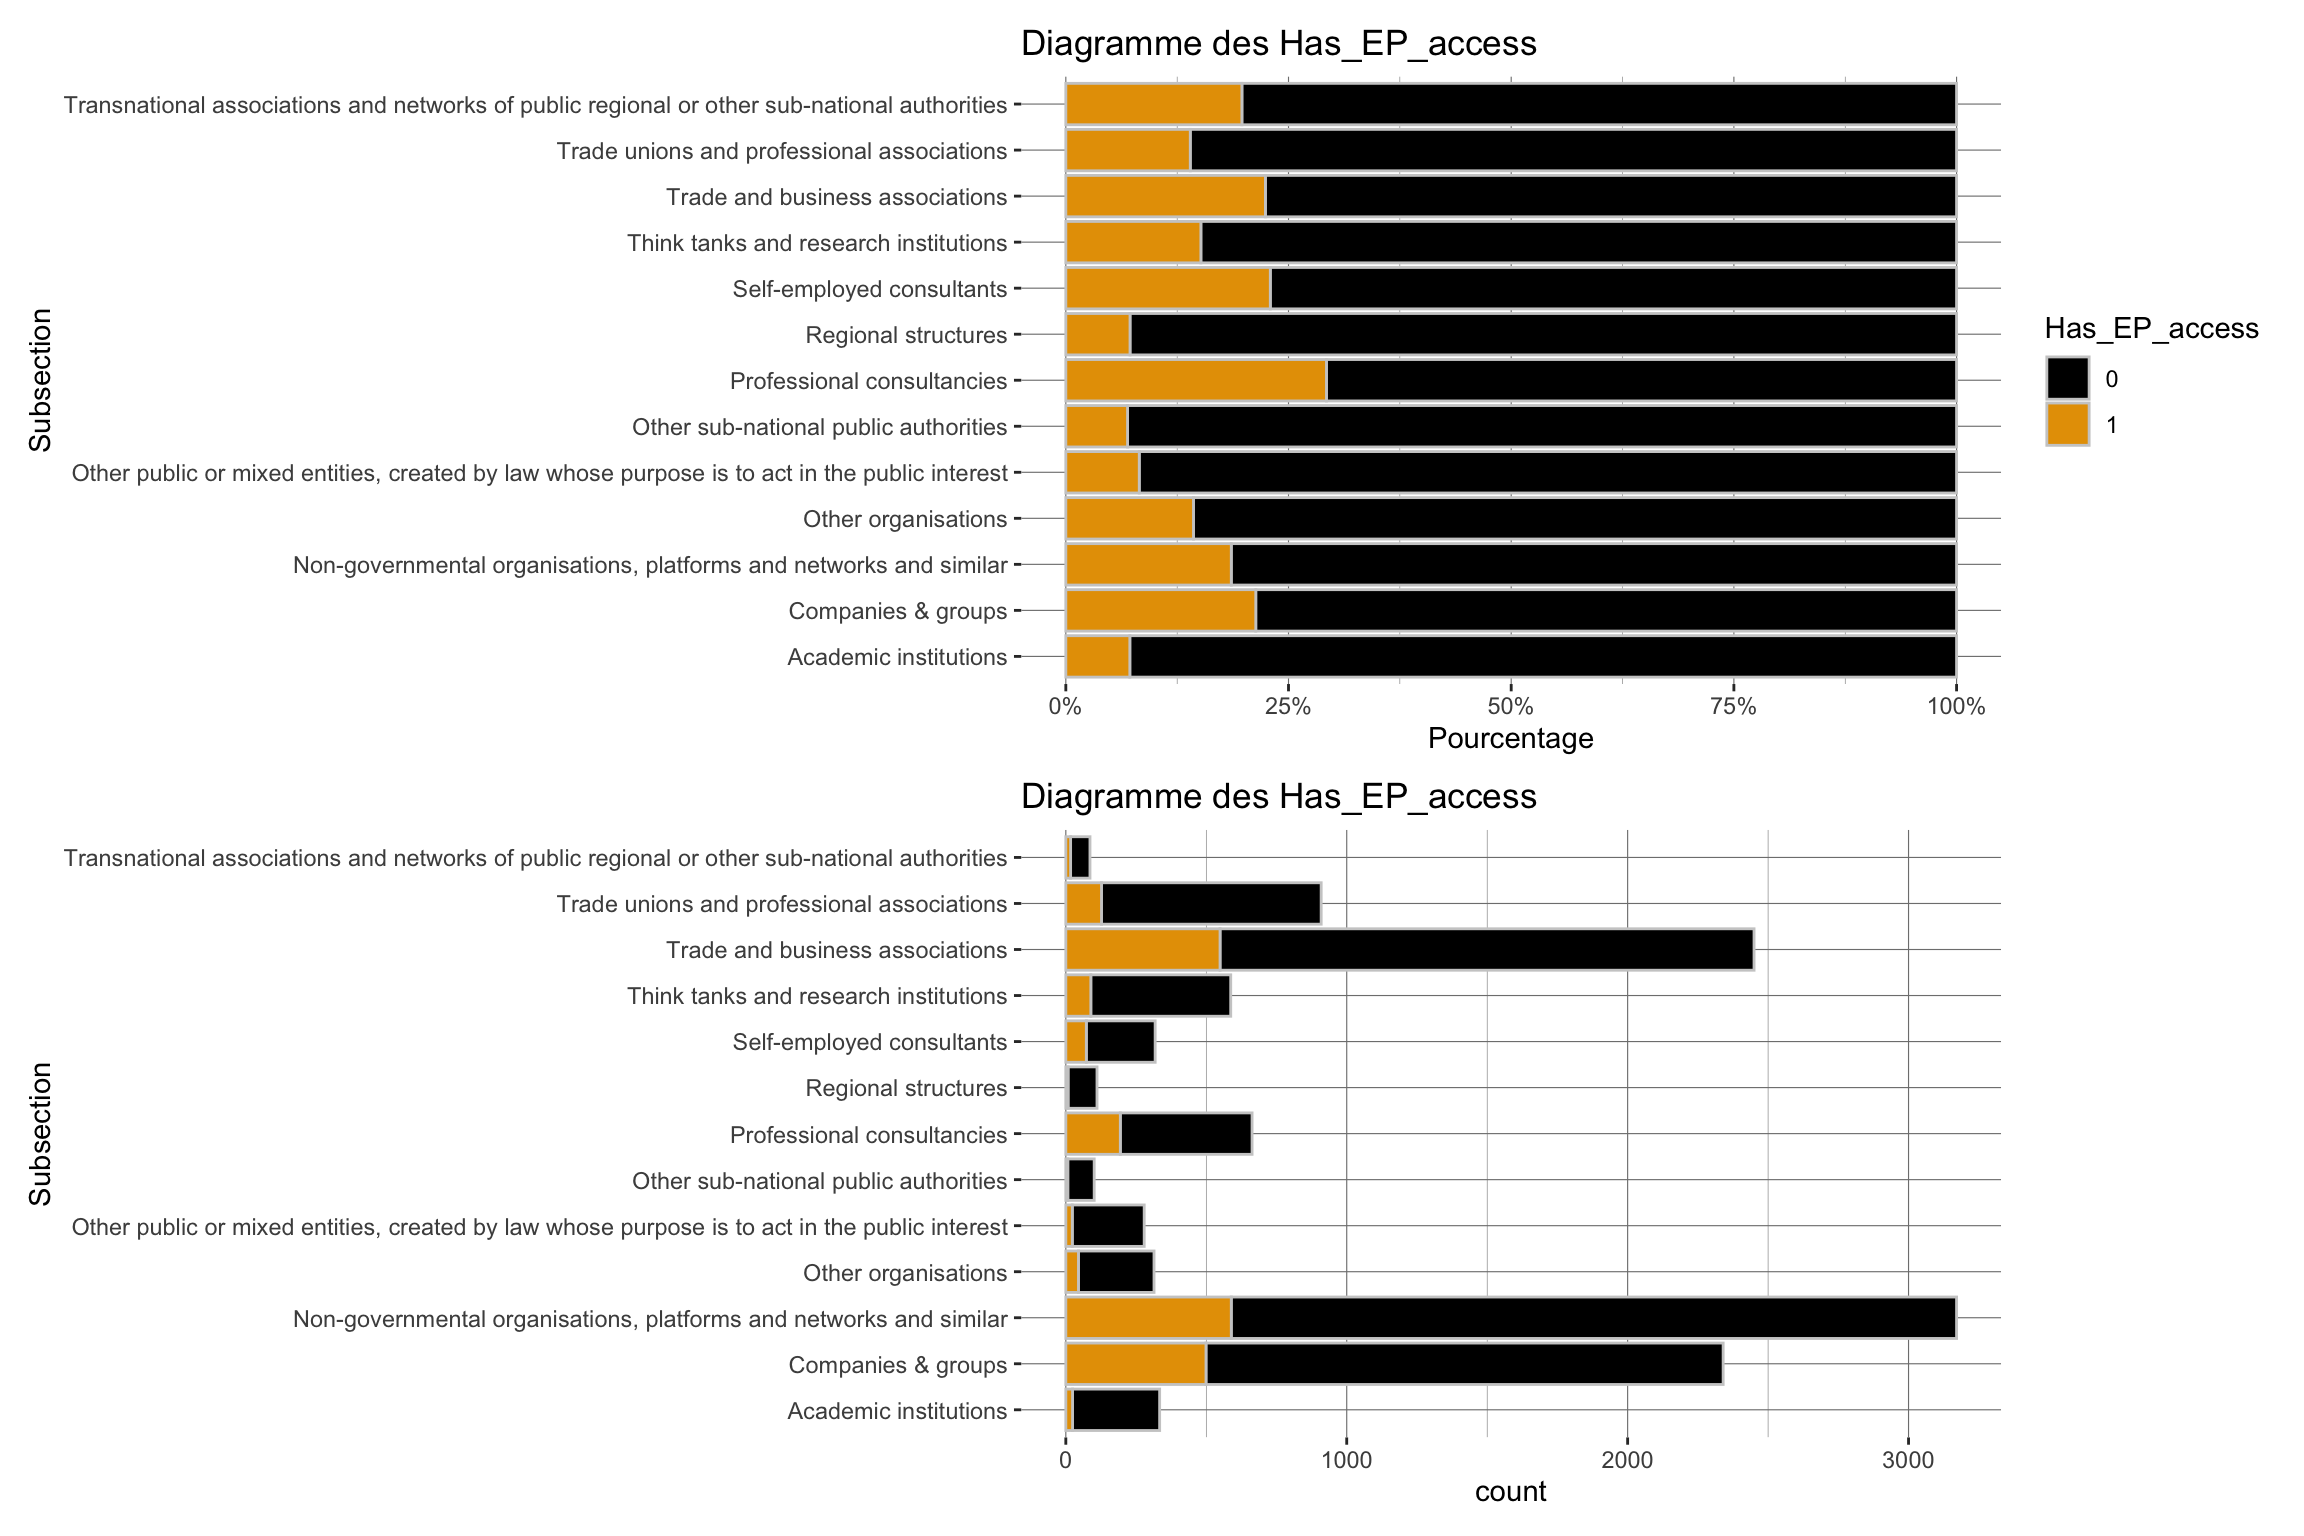
| Has_EP_access | ||||||||||||||||
| 0 | 310 (3.2%) | 1,841 (19%) | 91 (1.0%) | 2,582 (27%) | 29 (0.3%) | 269 (2.8%) | 256 (2.7%) | 94 (1.0%) | 469 (4.9%) | 103 (1.1%) | 245 (2.6%) | 498 (5.2%) | 1,901 (20%) | 782 (8.2%) | 69 (0.7%) | 9,539 (100%) |
| 1 | 24 (1.0%) | 499 (22%) | 23 (1.0%) | 589 (26%) | 24 (1.0%) | 45 (2.0%) | 23 (1.0%) | 7 (0.3%) | 194 (8.5%) | 8 (0.3%) | 73 (3.2%) | 89 (3.9%) | 549 (24%) | 127 (5.5%) | 17 (0.7%) | 2,291 (100%) |
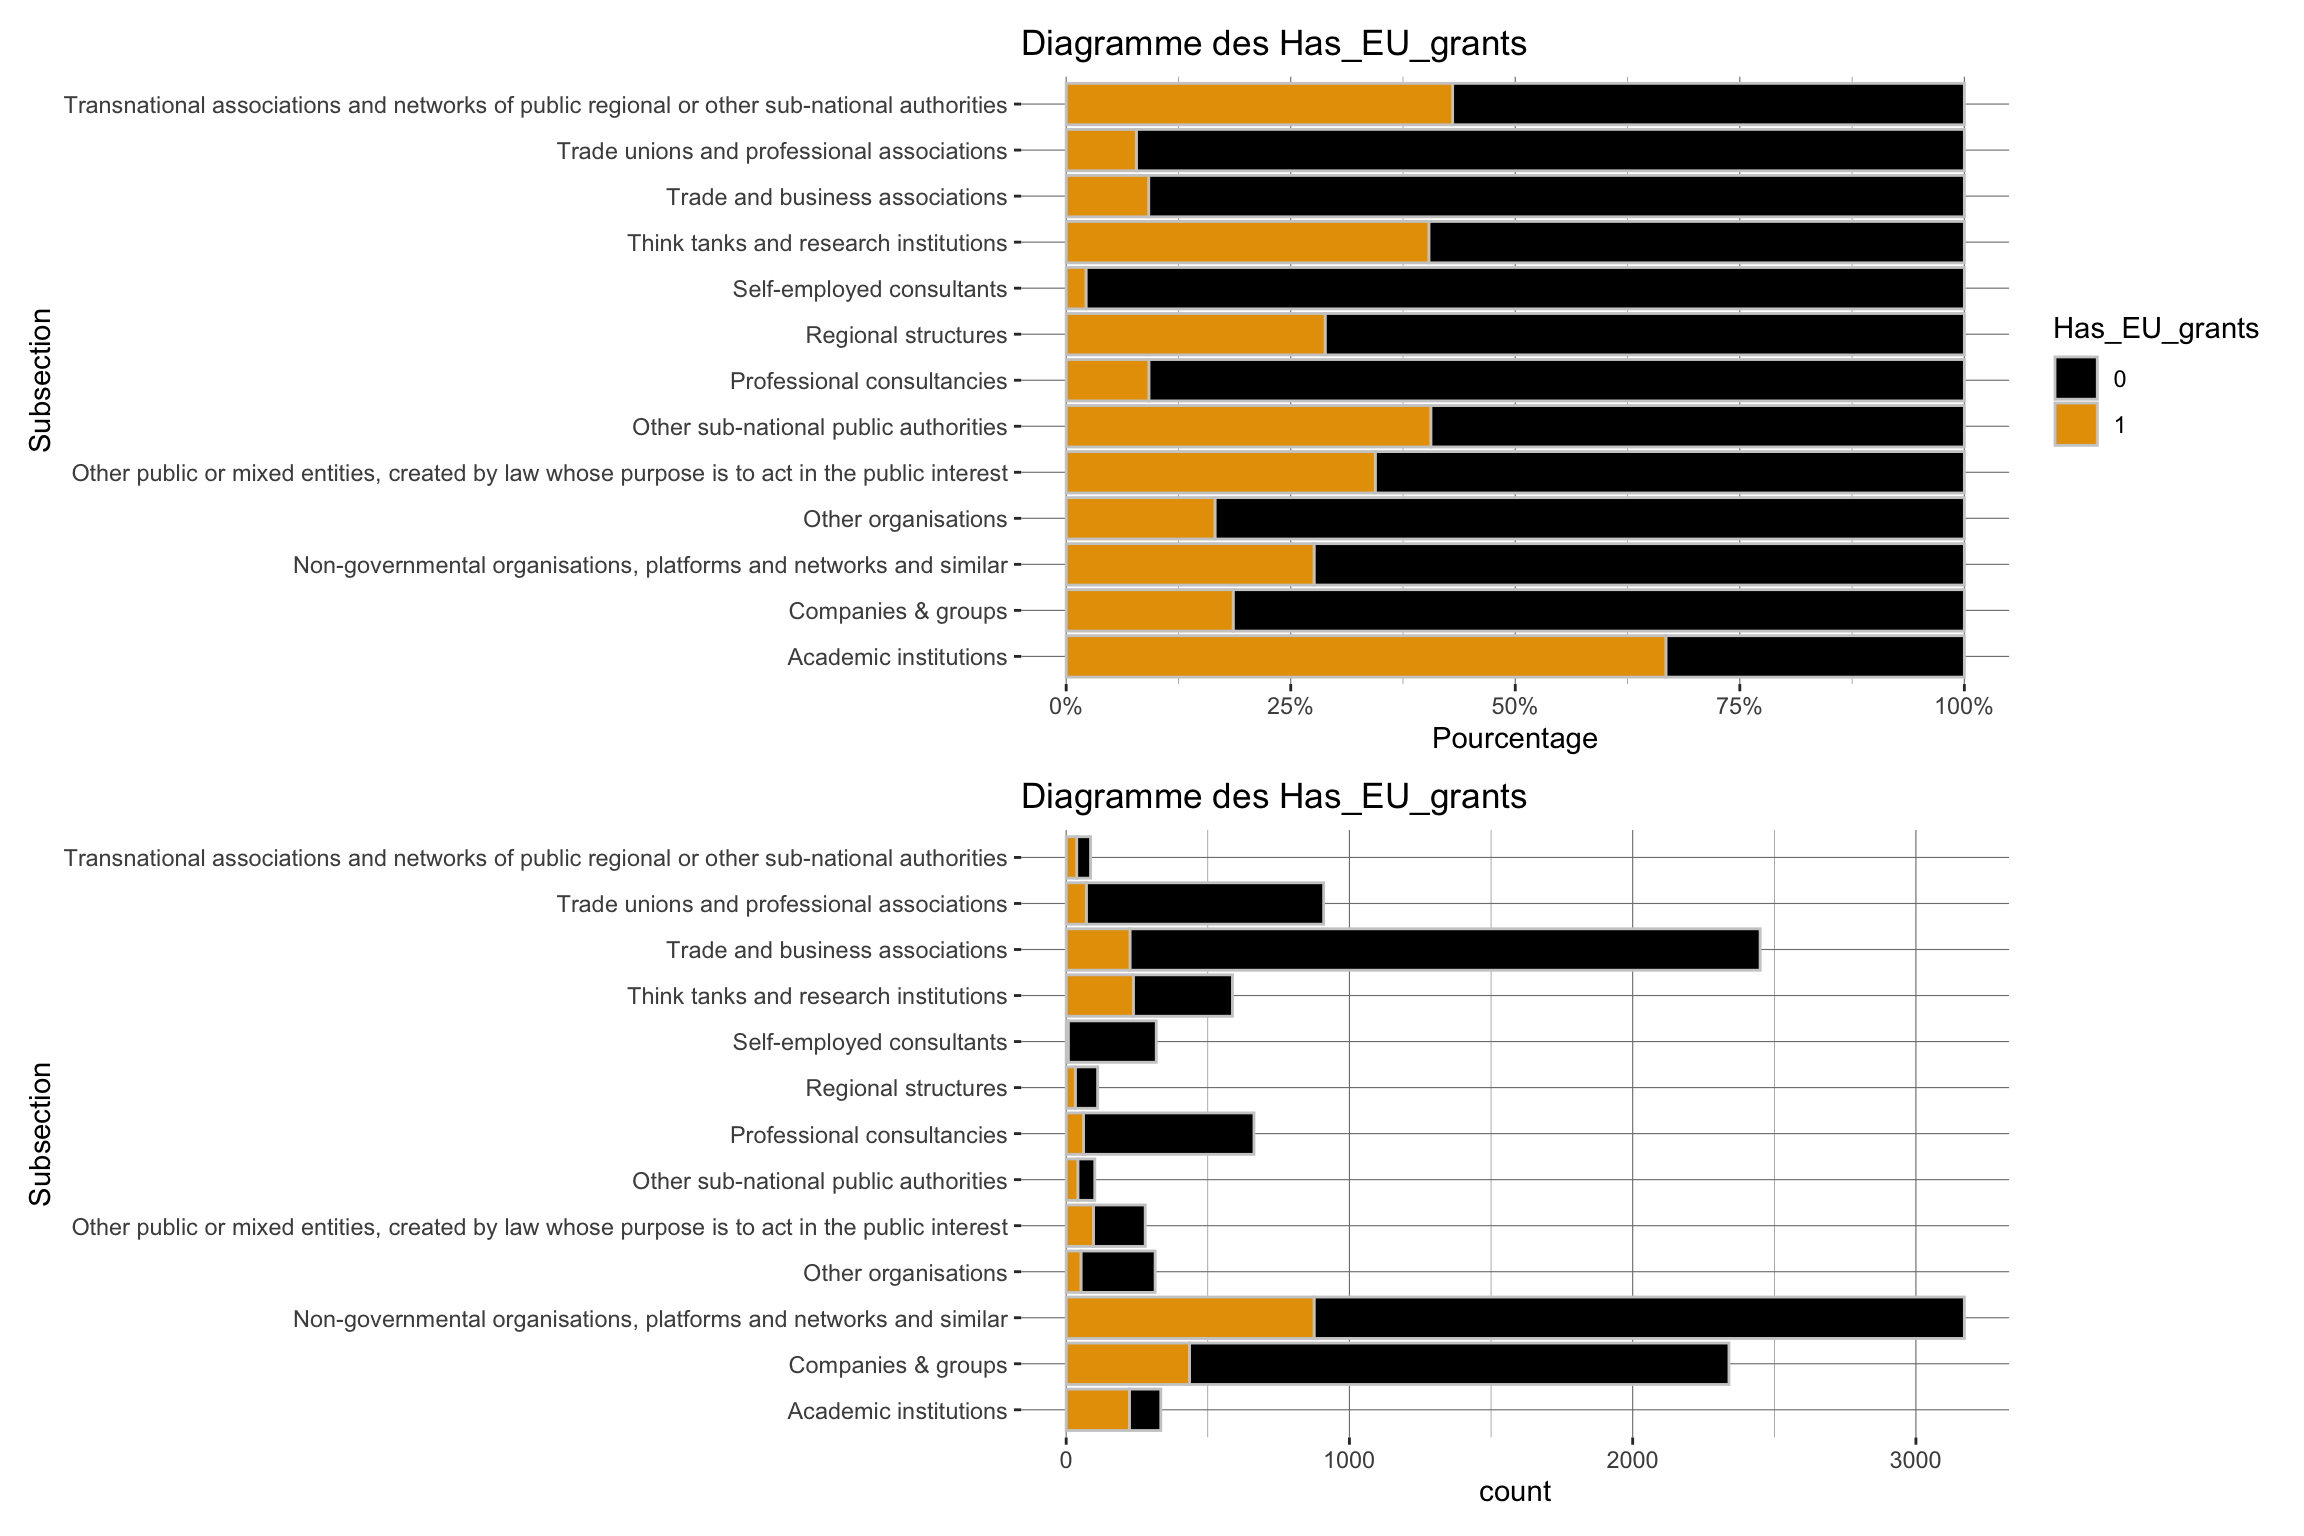
| Has_EU_grants | ||||||||||||||||
| 0 | 111 (1.2%) | 1,905 (20%) | 110 (1.2%) | 2,296 (24%) | 48 (0.5%) | 262 (2.8%) | 183 (1.9%) | 60 (0.6%) | 602 (6.4%) | 79 (0.8%) | 311 (3.3%) | 350 (3.7%) | 2,225 (24%) | 838 (8.9%) | 49 (0.5%) | 9,429 (100%) |
| 1 | 223 (9.3%) | 435 (18%) | 4 (0.2%) | 875 (36%) | 5 (0.2%) | 52 (2.2%) | 96 (4.0%) | 41 (1.7%) | 61 (2.5%) | 32 (1.3%) | 7 (0.3%) | 237 (9.9%) | 225 (9.4%) | 71 (3.0%) | 37 (1.5%) | 2,401 (100%) |
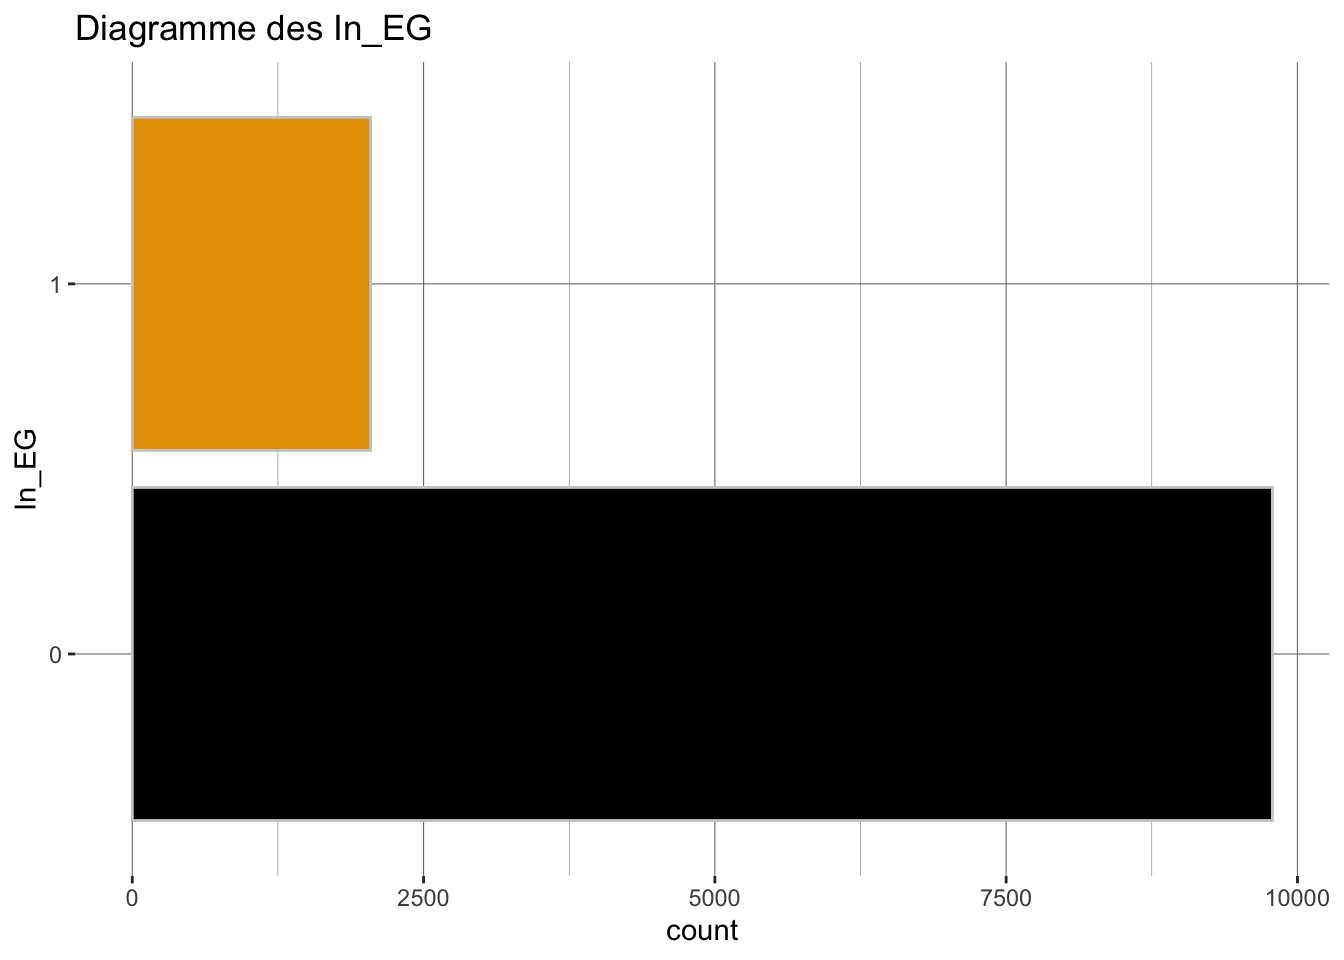
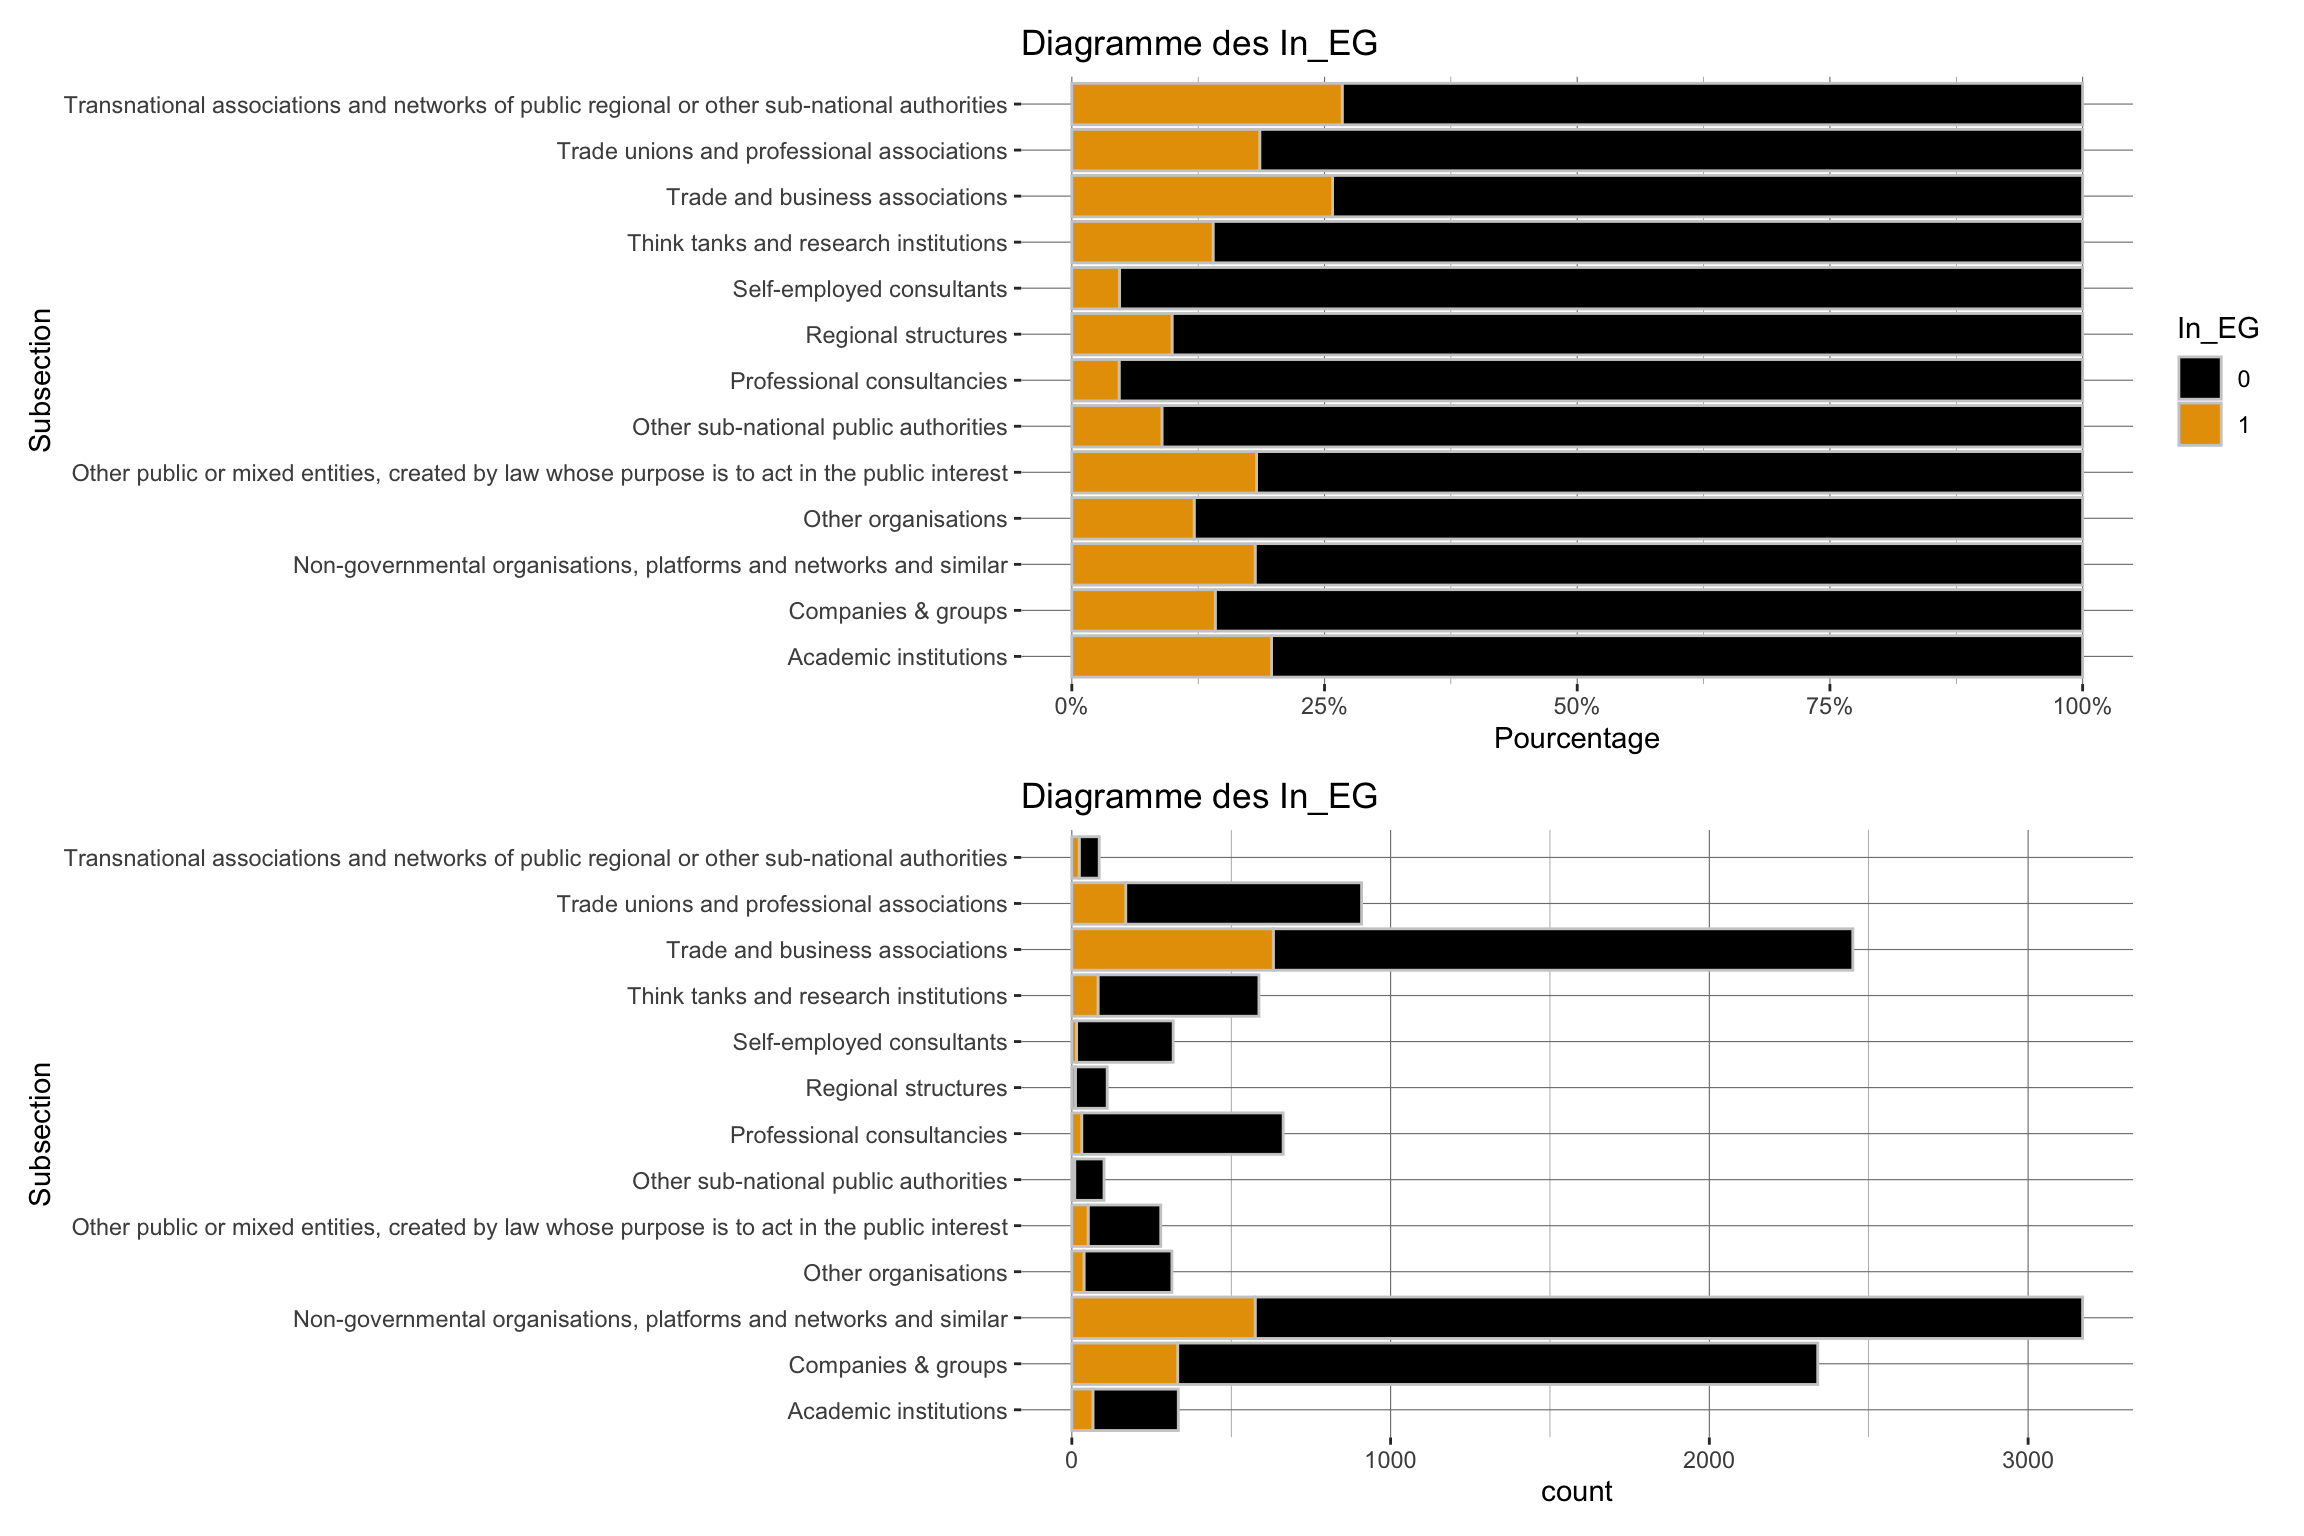
| In_EG | ||||||||||||||||
| 0 | 268 (2.7%) | 2,008 (21%) | 103 (1.1%) | 2,596 (27%) | 53 (0.5%) | 276 (2.8%) | 228 (2.3%) | 92 (0.9%) | 632 (6.5%) | 100 (1.0%) | 303 (3.1%) | 505 (5.2%) | 1,818 (19%) | 740 (7.6%) | 63 (0.6%) | 9,785 (100%) |
| 1 | 66 (3.2%) | 332 (16%) | 11 (0.5%) | 575 (28%) | 0 (0%) | 38 (1.9%) | 51 (2.5%) | 9 (0.4%) | 31 (1.5%) | 11 (0.5%) | 15 (0.7%) | 82 (4.0%) | 632 (31%) | 169 (8.3%) | 23 (1.1%) | 2,045 (100%) |
| Nb_EG | 1 (1, 1) - max = 4) | 1 (1, 1) - max = 5) | 1 (1, 1) - max = 1) | 1 (1, 2) - max = 44) | NA (NA, NA) - max = NA) | 1 (1, 2) - max = 25) | 1 (1, 1) - max = 7) | 1 (1, 1) - max = 5) | 1 (1, 1) - max = 5) | 1 (1, 1) - max = 5) | 1 (1, 1) - max = 1) | 1 (1, 2) - max = 7) | 1 (1, 3) - max = 51) | 1 (1, 3) - max = 33) | 1 (1, 2) - max = 5) | 1 (1, 2) - max = 51) |
| Unknown | 268 | 2,008 | 103 | 2,596 | 53 | 276 | 228 | 92 | 632 | 100 | 303 | 505 | 1,818 | 740 | 63 | 9,785 |
| 1 Median (Q1, Q3) - max = 100% Centile) ; n (%) | ||||||||||||||||
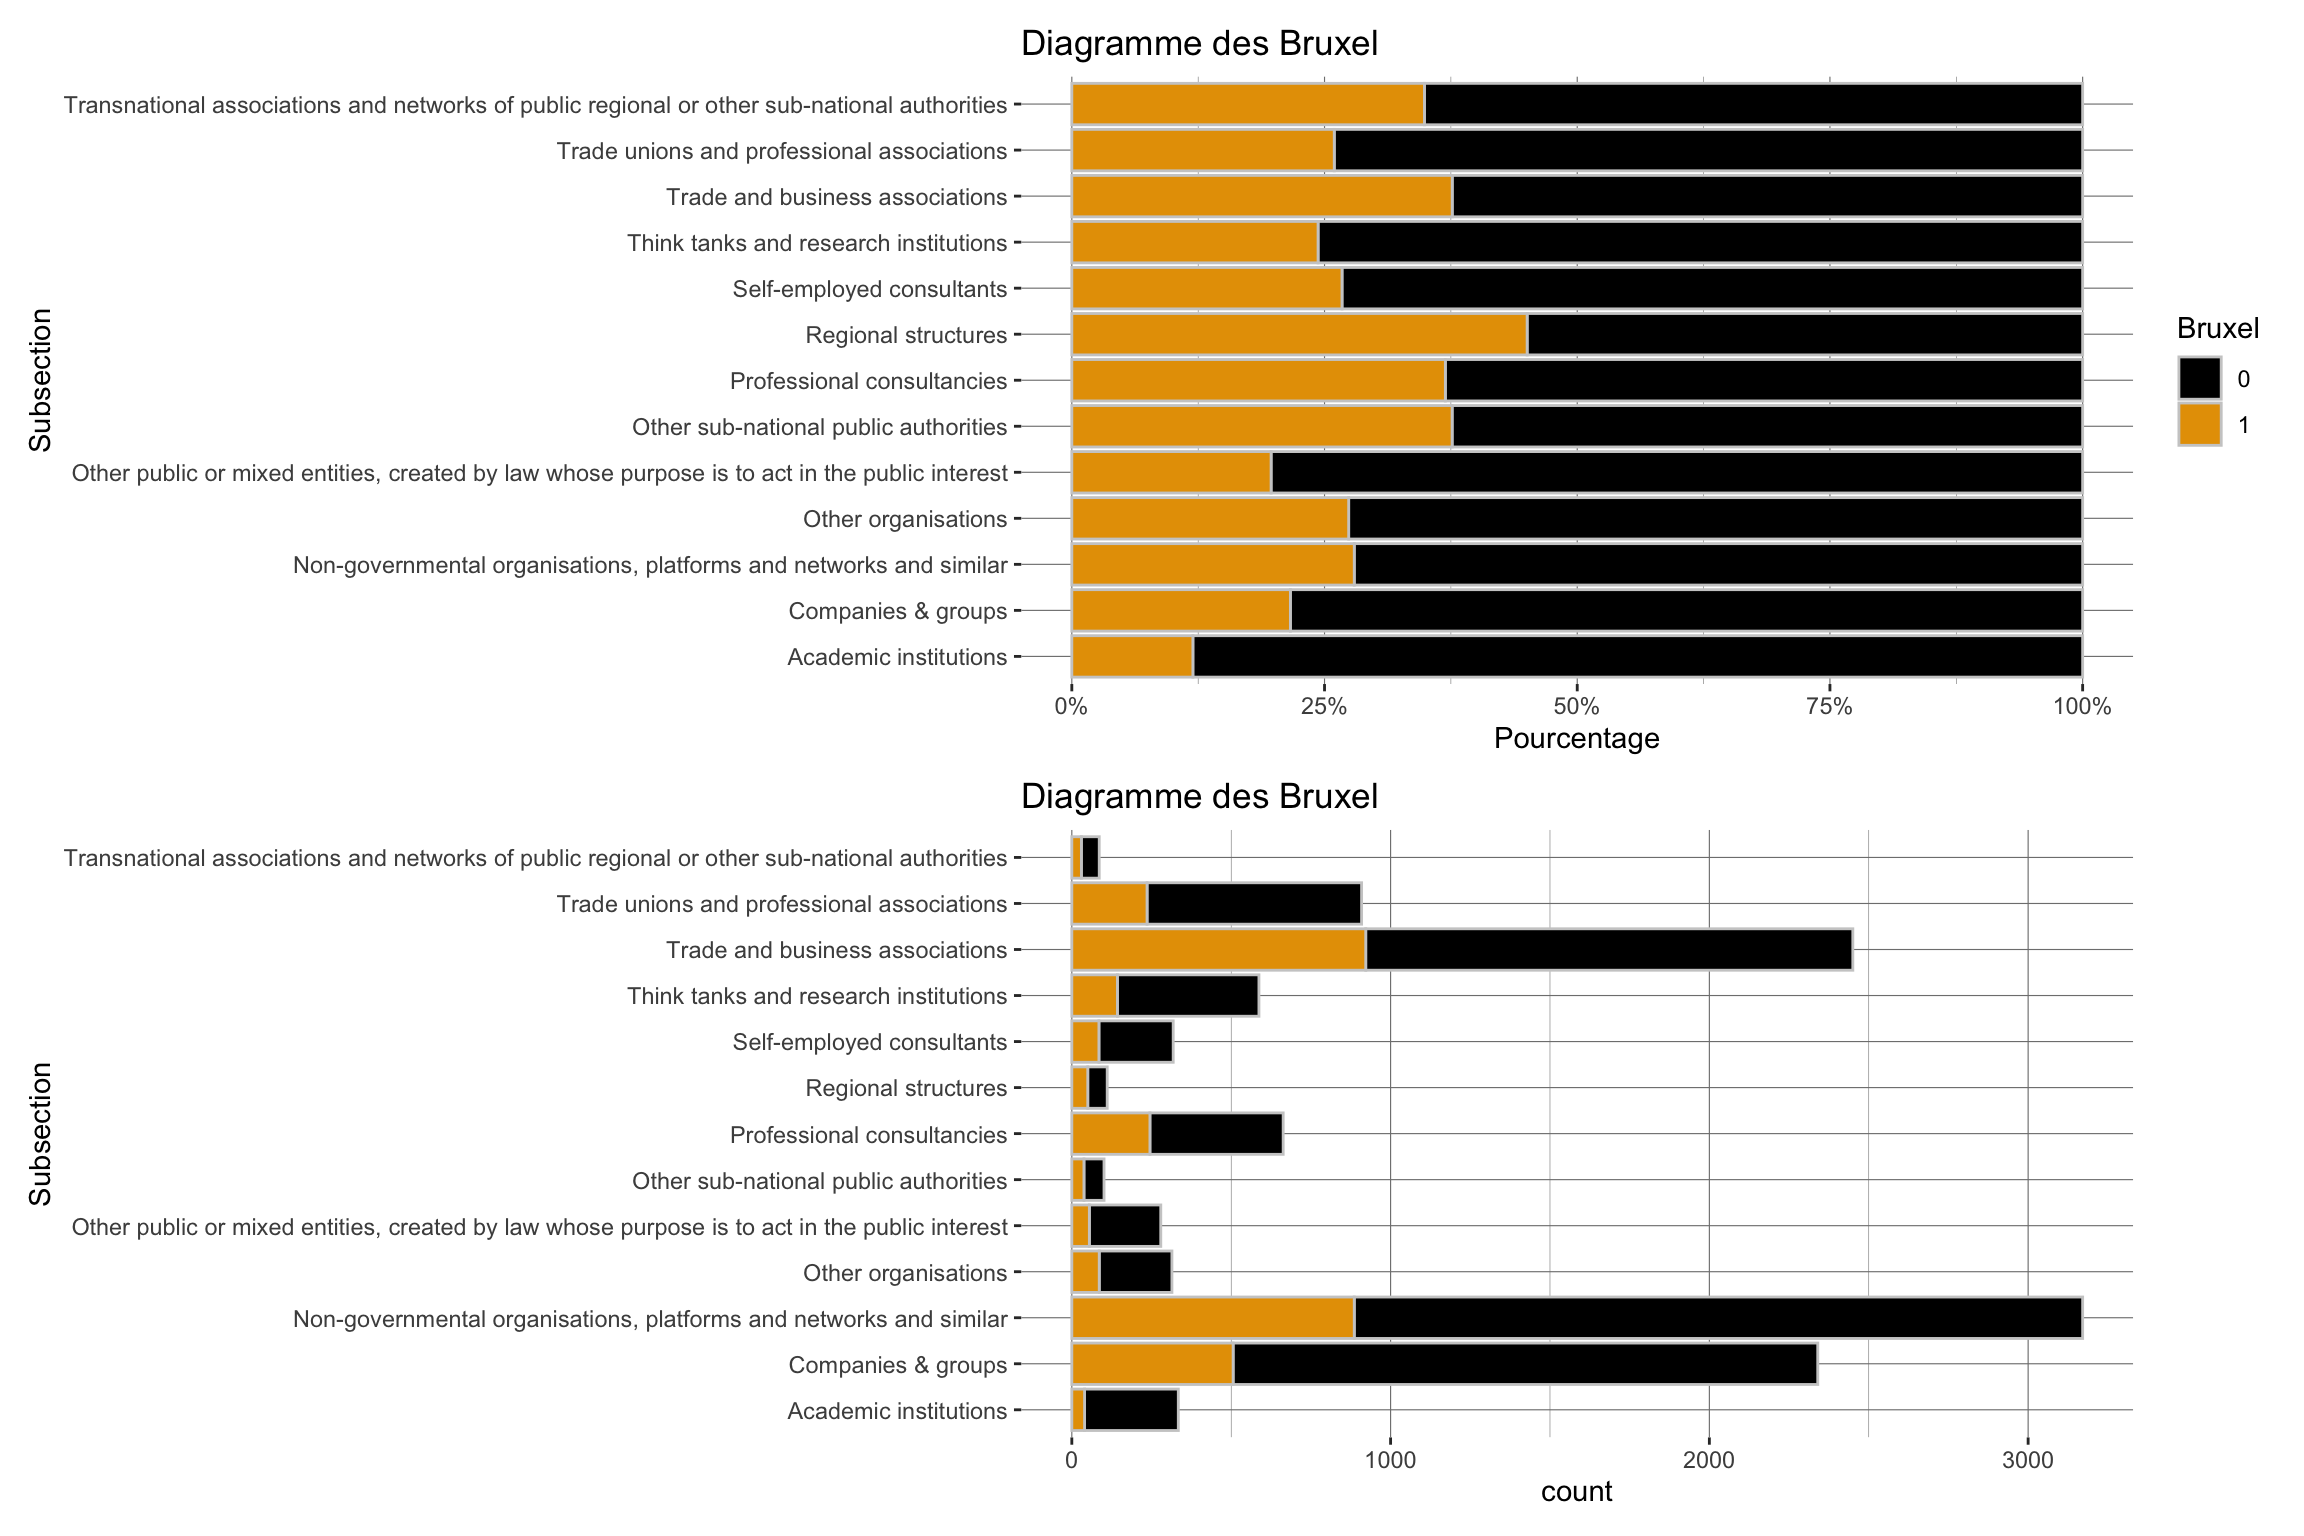
| Type d'organisation | |
| Dans le registre de transparence de 2019 | |
| Characteristic | N = 11,8301 |
|---|---|
| Subsection | |
| Academic institutions | 334 (2.8%) |
| Companies & groups | 2,340 (20%) |
| Law firms | 114 (1.0%) |
| Non-governmental organisations, platforms and networks and similar | 3,171 (27%) |
| Organisations representing churches and religious communities | 53 (0.4%) |
| Other organisations | 314 (2.7%) |
| Other public or mixed entities, created by law whose purpose is to act in the public interest | 279 (2.4%) |
| Other sub-national public authorities | 101 (0.9%) |
| Professional consultancies | 663 (5.6%) |
| Regional structures | 111 (0.9%) |
| Self-employed consultants | 318 (2.7%) |
| Think tanks and research institutions | 587 (5.0%) |
| Trade and business associations | 2,450 (21%) |
| Trade unions and professional associations | 909 (7.7%) |
| Transnational associations and networks of public regional or other sub-national authorities | 86 (0.7%) |
| 1 n (%) | |


   0%   10%   20%   30%   40%   50%   60%   70%   80%   90%  100%
0.25 0.25 0.25 0.50 0.75 1.00 1.25 2.00 2.75 5.00 91.50 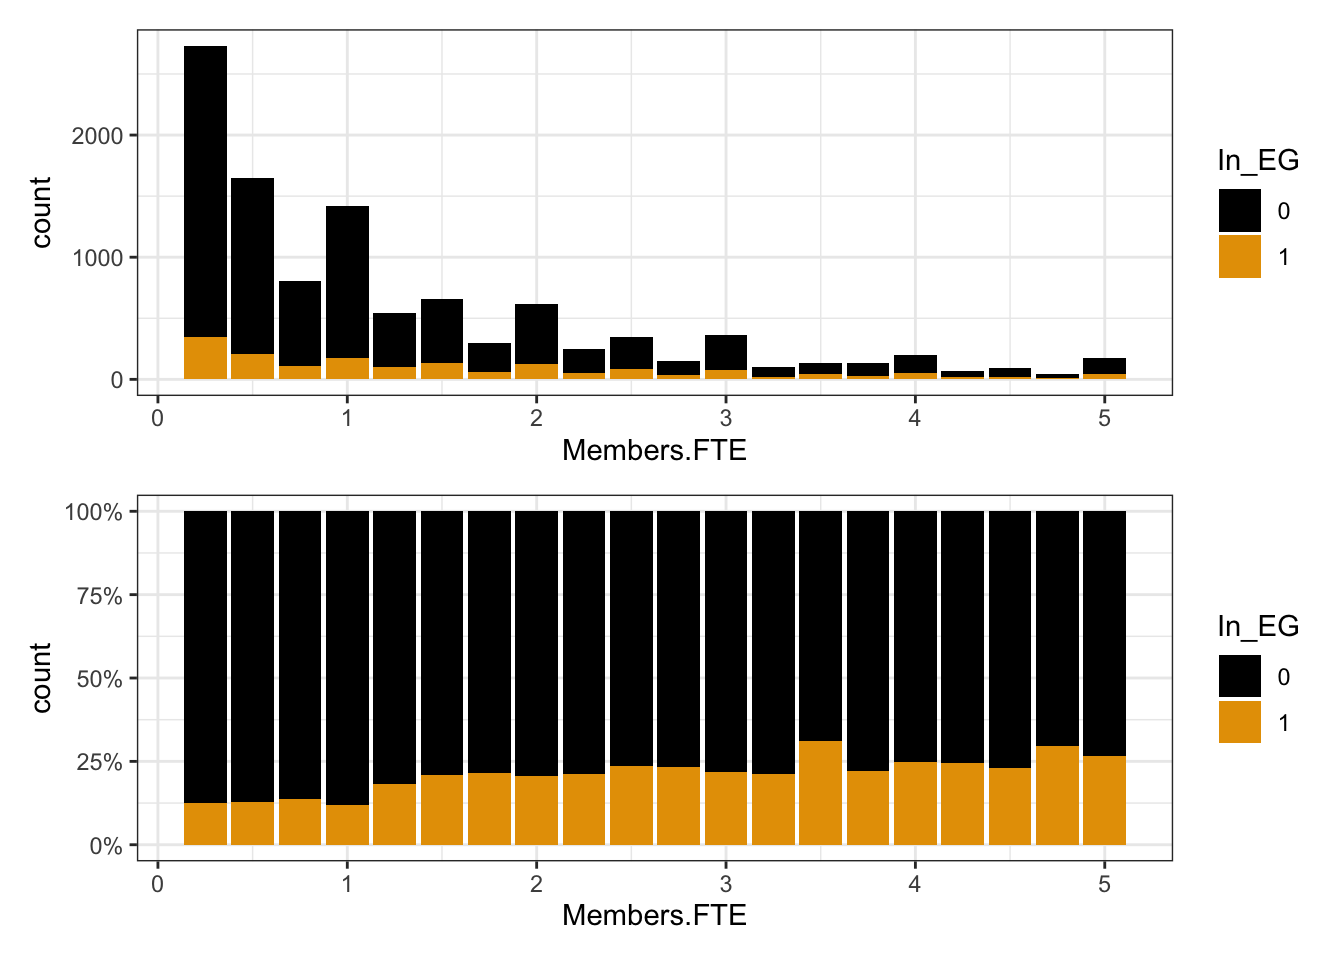
Le chargement a nécessité le package : grid (0,1] (1,2] (2,5] (5,10] (10,100]
6612 2106 2061 709 342 | Characteristic | 0 N = 9,7851 |
1 N = 2,0451 |
|---|---|---|
| FTE_RECO | ||
| (0,1] | 5,776 (59%) | 836 (41%) |
| (1,2] | 1,680 (17%) | 426 (21%) |
| (2,5] | 1,571 (16%) | 490 (24%) |
| (5,10] | 517 (5.3%) | 192 (9.4%) |
| (10,100] | 241 (2.5%) | 101 (4.9%) |
| 1 n (%) | ||
[1] 2.54046e-54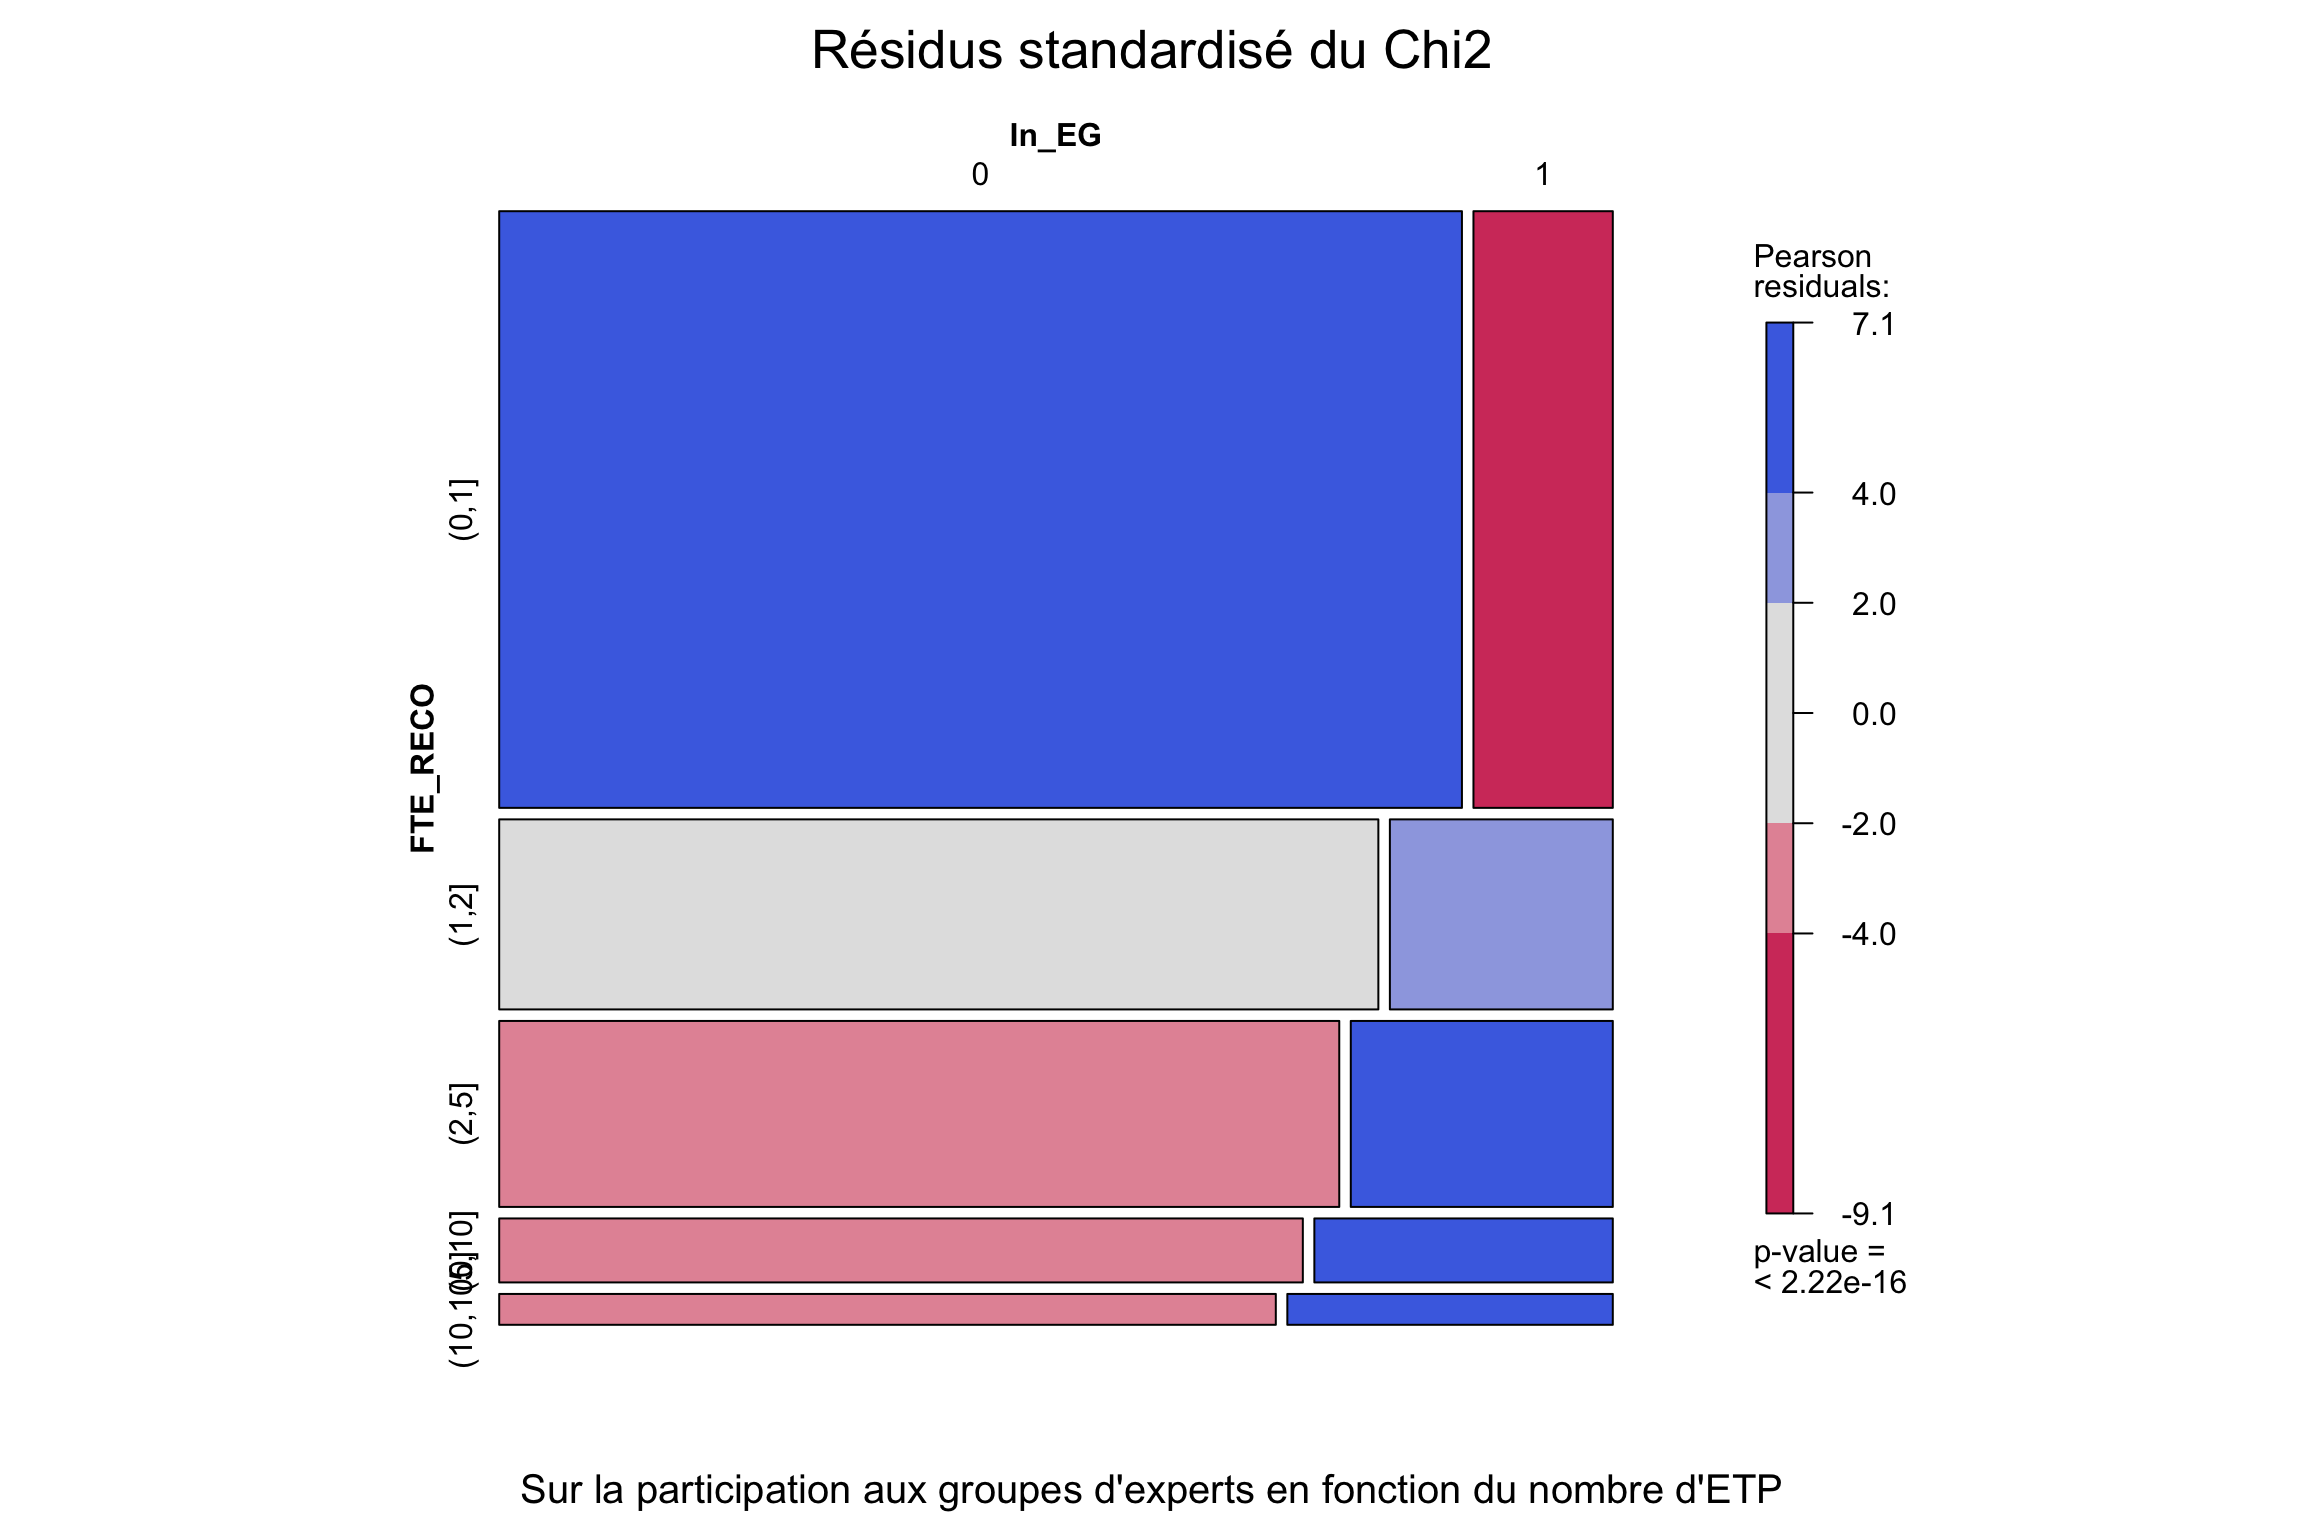
| Characteristic | N = 11,8301 |
|---|---|
| Bruxel | |
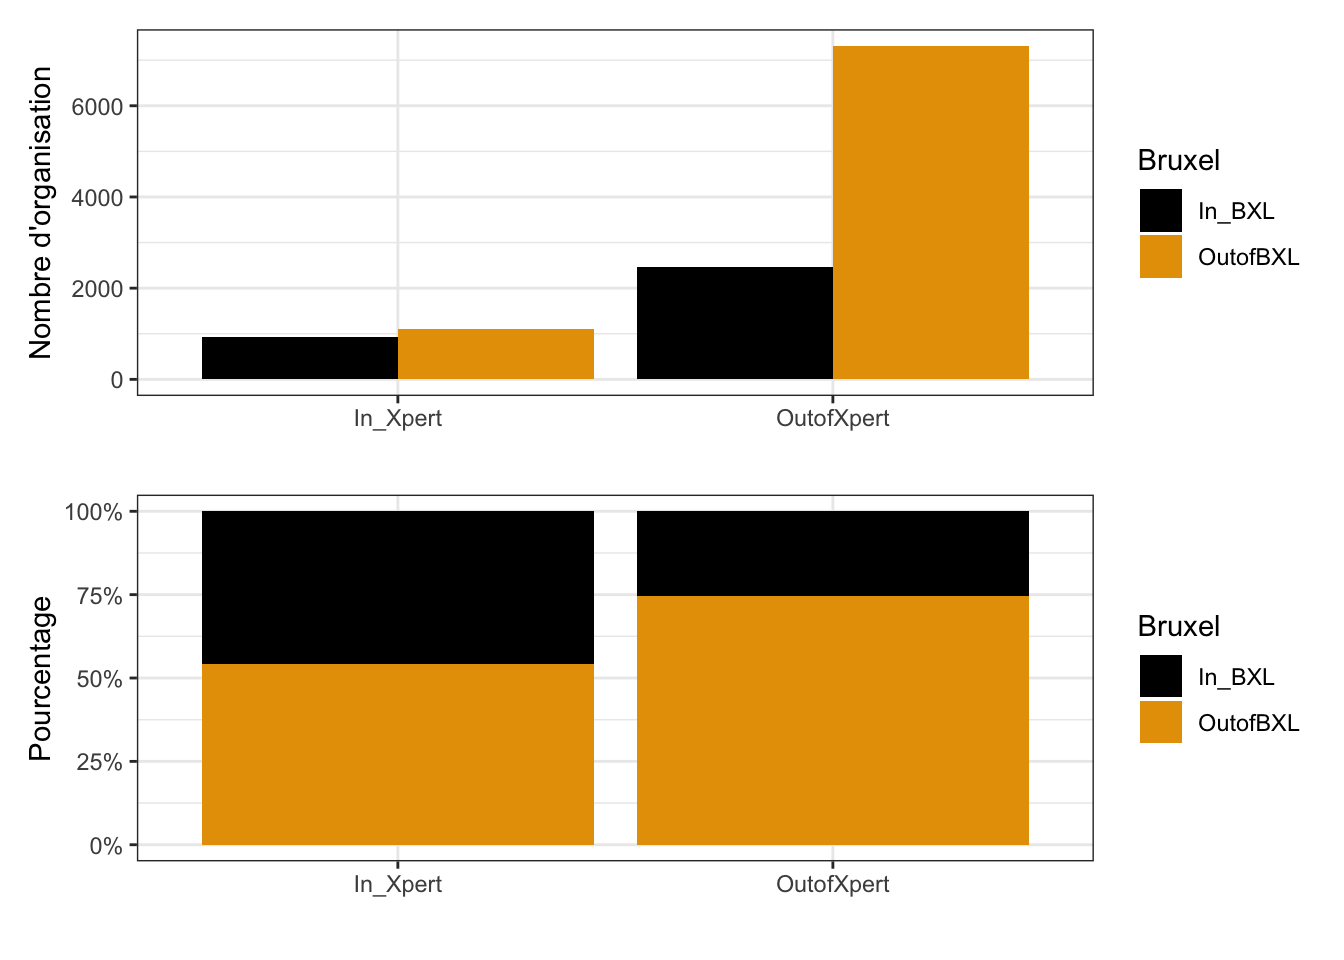
| 0 | 8,422 (71%) |
| 1 | 3,408 (29%) |
| 1 n (%) | |
| Characteristic | 0 N = 9,7851 |
1 N = 2,0451 |
|---|---|---|
| Bruxel | ||
| 0 | 7,313 (75%) | 1,109 (54%) |
| 1 | 2,472 (25%) | 936 (46%) |
| 1 n (%) | ||
[1] 3.411346e-77 TR19Full$Bruxel
TR19Full$In_EG 0 1
0 18.62363 -18.62363
1 -18.62363 18.62363 OR 2.5 % 97.5 % p
Fisher's test 2.4966 2.2603 2.7576 < 2.2e-16 ***
---
Signif. codes: 0 '***' 0.001 '**' 0.01 '*' 0.05 '.' 0.1 ' ' 1L’Odds ratio nous permet de lire que si on ne s’intéresse qu’à la participation à des groupes d’expert et à la présence de bureau à Bruxelles, on a 3,5 plus de chance de participer à un GE si l’on est à Bruxelles.
Resized limits to included dashed line in forest panel`height` was translated to `width`.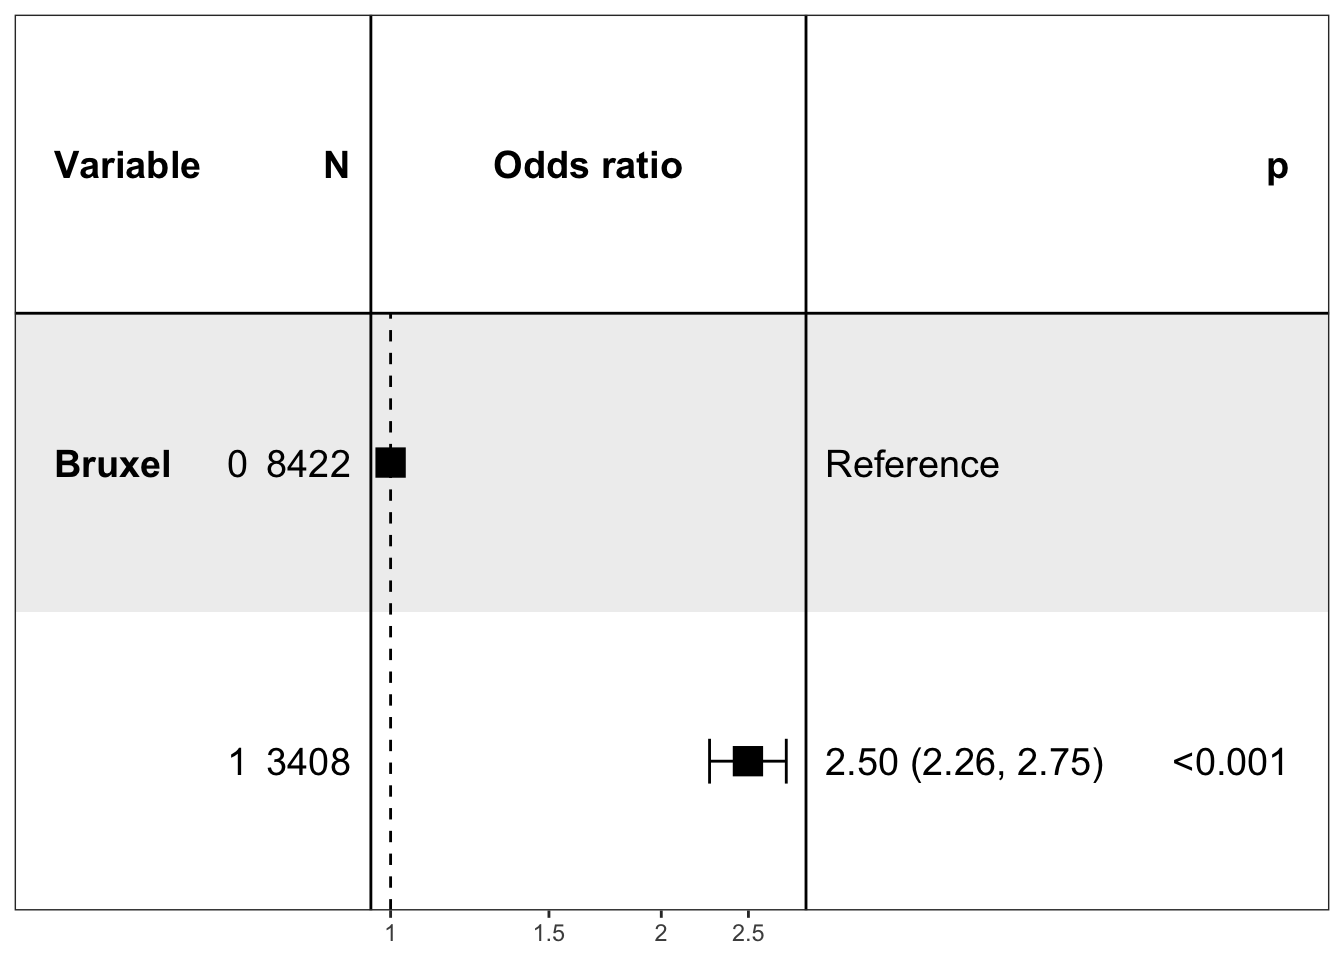
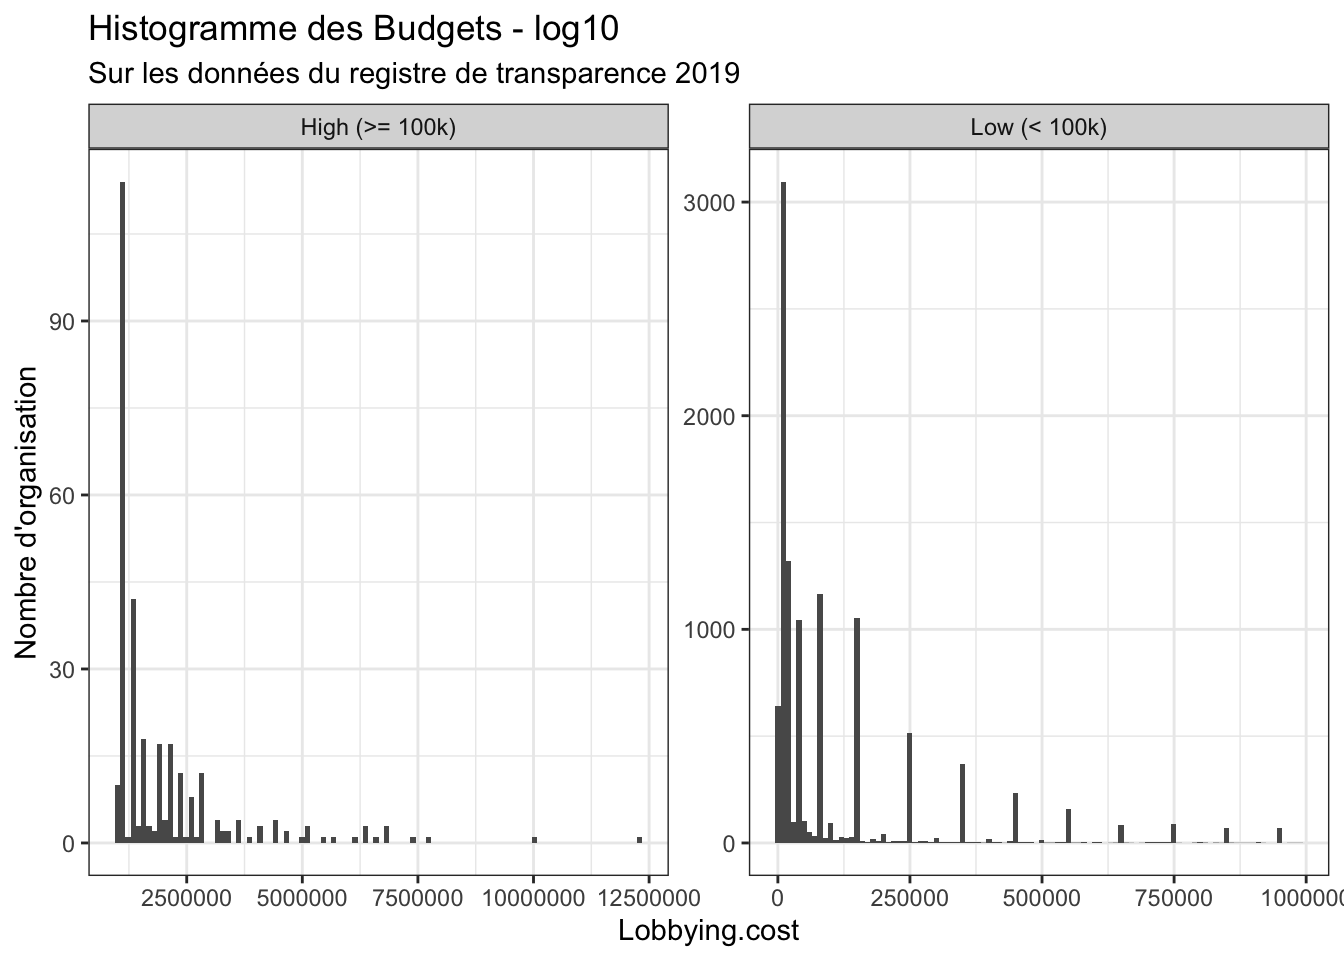
    Min.  1st Qu.   Median     Mean  3rd Qu.     Max.     NA's
       0     9999    37500   164321   150000 12300000      775
0% 30% 40% 50% 60% 70% 80%
0.0 9999.0 17500.0 37500.0 75000.0 130442.4 179238.6
90% 100%
450000.0 12300000.0 Warning: Removed 775 rows containing non-finite outside the scale range
(`stat_boxplot()`).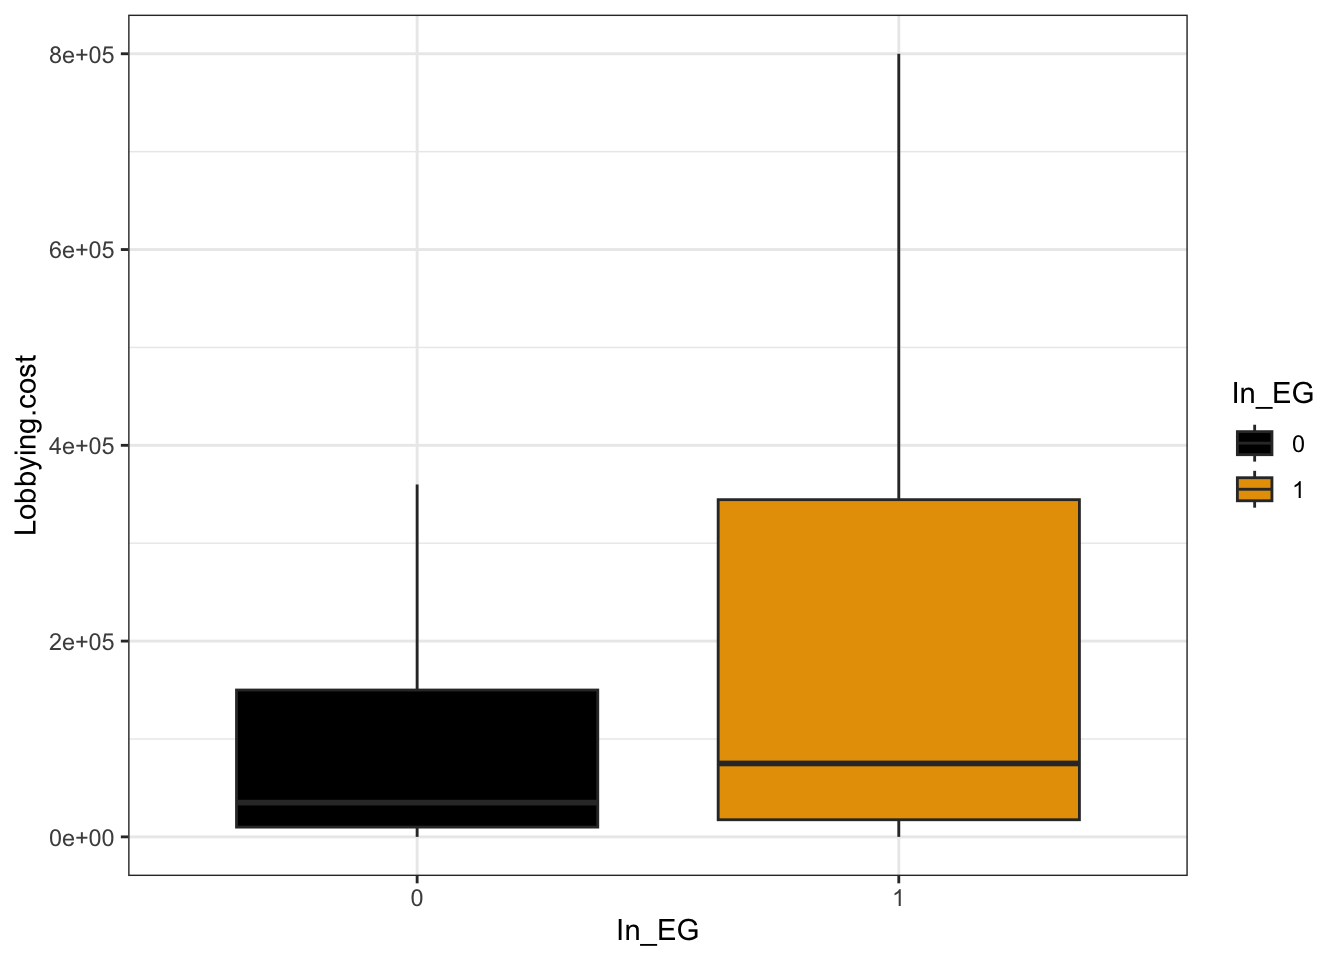
$`0`
    Min.  1st Qu.   Median     Mean  3rd Qu.     Max.     NA's
       0     9999    35000   136117   150000 10000000      749

$`1`
    Min.  1st Qu.   Median     Mean  3rd Qu.     Max.     NA's
       0    17500    75000   290550   344478 12300000       26
    Welch Two Sample t-test

data:  Lobbying.cost by In_EG
t = -10.492, df = 2321.6, p-value < 2.2e-16
alternative hypothesis: true difference in means between group 0 and group 1 is not equal to 0
95 percent confidence interval:
 -183295.9 -125569.8
sample estimates:
mean in group 0 mean in group 1
136116.7 290549.5 | Name | Lobbying.cost |
|---|---|
| Unisystems Systèmes Informatiques | 10000000 |
| Instituto de Telecomunicações (IT) | 7339567 |
| Fleishman-Hillard | 6875000 |
| European Council on Foreign Relations (ECFR) | 6875000 |
| FTI Consulting Belgium | 6875000 |
| European Centre for Development Policy Management (ECDPM) | 6375000 |
| Burson Cohn & Wolfe Sprl (formerly Burson-Marsteller Sprl) (BCW) | 6375000 |
| The Brookings Institution | 6375000 |
| Fundación Tekniker (TEKNIKER) | 5624500 |
| Altroconsumo (AC) | 5125000 |
| Interel European Affairs | 5125000 |
| Microsoft Corporation | 5125000 |
| Bruegel | 4939108 |
| Teneo Brussels | 4375000 |
| ExxonMobil Petroleum & Chemical (EMPC) | 3875000 |
| Kreab | 3624500 |
| Friends of Europe (FoE) | 3624500 |
| IBON International Foundation, Inc. | 3624500 |
| Stiftung Mercator | 3125000 |
| European Fund and Asset Management Association (EFAMA) | 3125000 |
| Equinor ASA (EQNR) | 3125000 |
| BP p.l.c. (BP) | 2875000 |
| GEIE des Utilisateurs d'ERTMS (EUG) | 2875000 |
| BDEW Bundesverband der Energie- und Wasserwirtschaft e. V. (BDEW) | 2875000 |
| DAB Italia s.c.p.a. (DAB Italia) | 2875000 |
| Dipartimento di Epidemiologia (DEASL) | 2800000 |
| APCO Worldwide | 2624500 |
| Grayling | 2624500 |
| G Plus Ltd (GPLUS) | 2624500 |
| EUTOP Europe GmbH (EUTOP) | 2624500 |
| Viapass | 2375641 |
| British American Tobacco (BAT) | 2375000 |
| Hill & Knowlton International Belgium (H+K) | 2375000 |
| BVI Bundesverband Investment und Asset Management e.V. (BVI) | 2375000 |
| Brunswick Group LLP | 2375000 |
| Facebook Ireland Limited (FB-I) | 2375000 |
| Novartis International AG | 2375000 |
| European Policy Centre (EPC) | 2375000 |
| Huawei Technologies (Huawei) | 2190000 |
| International Swaps and Derivatives Association (ISDA) | 2125000 |
| ELECTRICITE DE FRANCE (EDF) | 2125000 |
| Weber Shandwick, Creation, brand names of CMGRP Belgium SCRL | 2125000 |
| RPP Group (RPP Group) | 2125000 |
| WindEurope | 2125000 |
| ENGIE (ENGIE) | 2125000 |
| Reform Society i Stockholm AB (Reform Society) | 2125000 |
| The Joint Institute for Innovation Policy (JIIP) | 2125000 |
| Association pour les Transferts de Technologies du Mans (CTTM) | 2125000 |
| EUROPEAN MAR II, LDA. & COMANDITA (ZONA FRANCA DA MADEIRA) (Euromar) | 2000000 |
| Malaysian Employers Federation (MEF) | 1981062 |
| TOTAL S.A. | 1875000 |
| EVONIK INDUSTRIES AG | 1875000 |
| Instituut voor Bestuurders / L'Institut des Administrateurs (GUBERNA) | 1875000 |
| FIPRA International Limited (FIPRA) | 1875000 |
| Rosa Luxemburg Stiftung Brussels Office | 1875000 |
| Finance Denmark (FiDa) | 1875000 |
| City of London Corporation (CoLC) | 1875000 |
| UK Finance Limited (UK Finance) | 1875000 |
| Vodafone Belgium SA (VBSA) | 1875000 |
| Scotland Europa | 1875000 |
| Merck | 1750699 |
| Deutsche Telekom (DT) | 1680000 |
| Museumvereniging | 1672418 |
| Syngenta International AG | 1624500 |
| Japan Bank for International Cooperation | 1624500 |
| GlaxoSmithKline (GSK) | 1624500 |
| Bundesverband der Deutschen Volksbanken und Raiffeisenbanken (BVR) | 1624500 |
| Associazione Bancaria Italiana (ABI) | 1624500 |
| ACTION EUROPE | 1624500 |
| Rolls-Royce plc | 1624500 |
| Credit Suisse Group AG (CSAG) | 1624500 |
| Barncancerfonden | 1624500 |
| Konrad-Adenauer-Stiftung (KAS) | 1624500 |
| South Denmark European office (SDEO) | 1609591 |
| Syndicat national des entreprises artistiques et culturelles (SYNDEAC) | 1500000 |
| Amgen Inc | 1375000 |
| Association of British Insurers (ABI) | 1375000 |
| Bank of America Merrill Lynch (BofAML) | 1375000 |
| JT International (JTI) | 1375000 |
| Secretariat of COMECE (Commission of the Episcopates of the European Union) (COMECE Secretariat) | 1375000 |
| Hume Brophy (HB) | 1375000 |
| VinylPlus | 1375000 |
| Monsanto (MON) | 1375000 |
| Federation of European Securities Exchanges (FESE) | 1375000 |
| University of Warwick | 1375000 |
| Philip Morris International Inc. (PMI) | 1375000 |
| UBS Group AG (UBS) | 1375000 |
| Centre for European Reform (CER) | 1375000 |
| European Social Network (ESN) | 1375000 |
| King Baudouin Foundation (KBF) | 1375000 |
| Centre for Fine Arts (BOZAR) | 1375000 |
| NRD CS (NRD Cyber Security) | 1375000 |
| Industrieanlagen-Betriebsgesellschaft mbH (IABG mbH) | 1375000 |
| The Applied Research Institute - Jerusalem (ARIJ) | 1375000 |
| Institut français de recherche pour l’exploitation de la mer (IFREMER) | 1375000 |
| Huntsman | 1375000 |
| Intel Corporation | 1375000 |
| Institut Jacques Delors / Jacques Delors Institute (IJD / JDI) | 1375000 |
| Trinomics B.V. | 1375000 |
| Związek Gmin i Powiatów Subregionu Centralnego Województwa Śląskiego (ZGiPSCWSL) | 1375000 |
| Rante (RNTE) | 1375000 |
| Rupprecht Consult - Forschung & Beratung GmbH (Rupprecht) | 1319058 |
| Invest Europe (Invest Europe) | 1125000 |
| Cisco Systems Inc. (Cisco) | 1125000 |
| Caritas Europa (Caritas Europa) | 1125000 |
| Avisa Partners | 1125000 |
| Finnish Energy - Energiateollisuus ry (ET) | 1125000 |
| IFPI Representing recording industry worldwide (I.F.P.I.) | 1125000 |
| Hitachi Corporate Office, Europe (Hitachi) | 1125000 |
| LVMH Publica (LVMH Publica) | 1125000 |
| Chevron Belgium BVBA (Chevron) | 1125000 |
| Eni S.p.A. | 1125000 |
| EURALIA | 1125000 |
| Platform for International Cooperation on Undocumented Migrants (PICUM) | 1125000 |
| Istituto Sindacale per la Cooperazione allo Sviluppo (ISCOS) | 1125000 |
| The Pew Charitable Trusts (Pew) | 1125000 |
| Liberty Global BV (Liberty Global) | 1125000 |
| Save the Children International | 1125000 |
| UK Research Office (UKRO) | 1125000 |
| Stiftung Ordnungspolitik - Centrum für Europäische Politik (CEP) | 1125000 |
| Apple Inc. | 1125000 |
| SANOFI | 1125000 |
| BioForum Vlaanderen (BioForum) | 1125000 |
| Nove (Nove) | 1125000 |
| Frequentis AG | 1125000 |
| University College London (UCL) | 1125000 |
| Cooperatie Kottervisserij Nederland (VisNed) (VisNed) | 1125000 |
| European Partnership for Democracy (EPD) | 1125000 |
| CERIC-ERIC (CERIC-ERIC) | 1125000 |
| The Goldman Sachs Group, Inc. (GS) | 1125000 |
| European Council on Refugees and Exiles (ECRE) | 1125000 |
| COBRA INSTALACIONES Y SERVICIOS,S.A. (Cobra) | 1125000 |
| Suade Labs Limited (SUADE) | 1125000 |
| Wemos Foundation (Wemos) | 1125000 |
| European Festivals Association (EFA) | 1125000 |
| Sociedade Portuguesa para o Estudo das Aves (SPEA) | 1125000 |
| Non Profit Enterprise and Self-sustainability Team (NESsT) | 1125000 |
| Fair Trials (FT) | 1125000 |
| The Investment Association (IA) | 1125000 |
| European Mortgage Federation - European Covered Bond Council (EMF-ECBC) | 1125000 |
| Terre des Hommes International Federation (TDHIF) | 1125000 |
| F. Hoffmann-La Roche Ltd (Roche) | 1125000 |
| Managed Funds Association (MFA) | 1125000 |
| Johnson & Johnson (J&J) | 1125000 |
| Covington & Burling LLP (Covington) | 1125000 |
| INOVYN ChlorVinyls | 1125000 |
| Carnegie Europe | 1125000 |
| The German Marshall Fund of the United States - The Transatlantic Foundation (GMF - TF) | 1125000 |
| ANIMA Investment Network (ANIMA) | 1125000 |
| Hanover Communications International | 1125000 |
| Inserm Transfert (IT) | 1125000 |
| Plataforma per la Llengua | 1125000 |
| Unión Nacional de Instituciones para el Trabajo de Acción Social (UNITAS) | 1125000 |
| Fédération Nationale de l'Artisanat Automobile (FNA) | 1125000 |
| Mémorial de la Shoah | 1125000 |
| Universidade do Porto (U.Porto) | 1125000 |
| Institut für Weltwirtschaft (IfW) | 1125000 |
| Wayna Aero (Waynabox) | 1125000 |
| Links Management and Technology S.p.A. (Links) | 1125000 |
| DIRECCIÓN DE ENERGÍA (COMISIÓN NACIONAL DE LOS MERCADOS Y LA COMPETENCIA) (CNMC) | 1125000 |
| Vlaamse Instelling voor Technologisch Onderzoek (VITO) | 1125000 |
| Royal Automobile Club Spa (RAC Spa) | 1125000 |
| Skane Lans Landsting (Region Skåne) | 1125000 |
| Navigant Netherlands B.V. (Navigant) | 1125000 |
| Ajuntament de Barcelona (Barcelona) | 1125000 |
| European Health Forum Gastein (EHFG) | 1125000 |
| FUNDACION TOMILLO | 1125000 |
| Център за изследване на демокрацията / Center for the Study of Democracy (CSD) | 1125000 |
| People for the Ethical Treatment of Animals Foundation (PETA UK) | 1125000 |
| GroentenFruit Huis | 1125000 |
| International Step by Step Association (ISSA) | 1125000 |
| UNIVERSITAS 21 (U21) | 1125000 |
| Jesuit Refugee Service - Europe (JRS-E) | 1122366 |
| Organización Mundial de Ciudades y Gobiernos Locales Unidos - United Cities and Local Governments (UCLG) | 1075000 |
Warning: Removed 1239 rows containing non-finite outside the scale range (`stat_bin()`).
Removed 1239 rows containing non-finite outside the scale range (`stat_bin()`).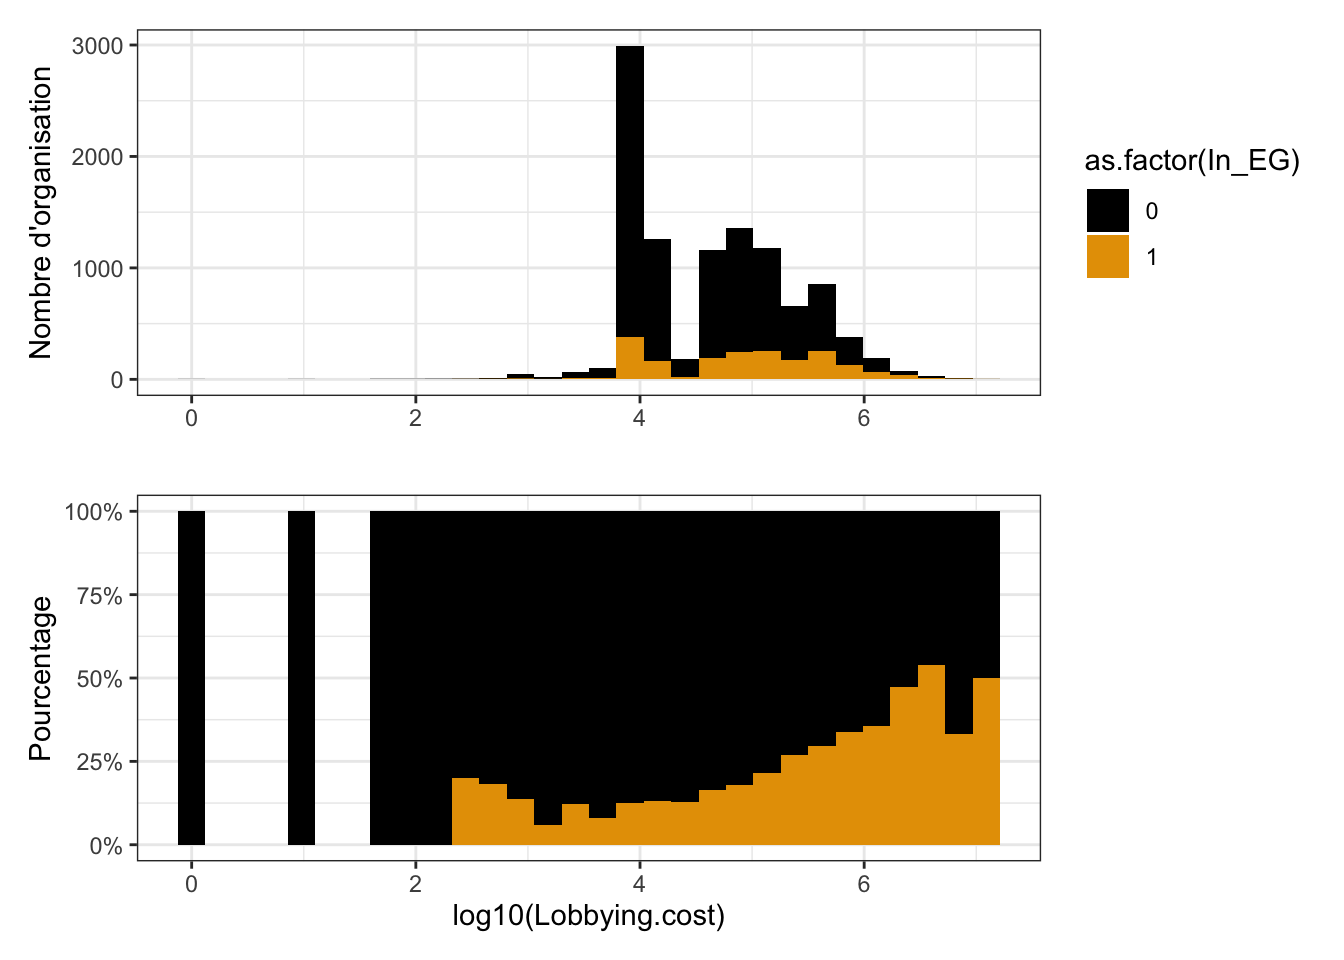
| Characteristic | N = 11,8301 |
|---|---|
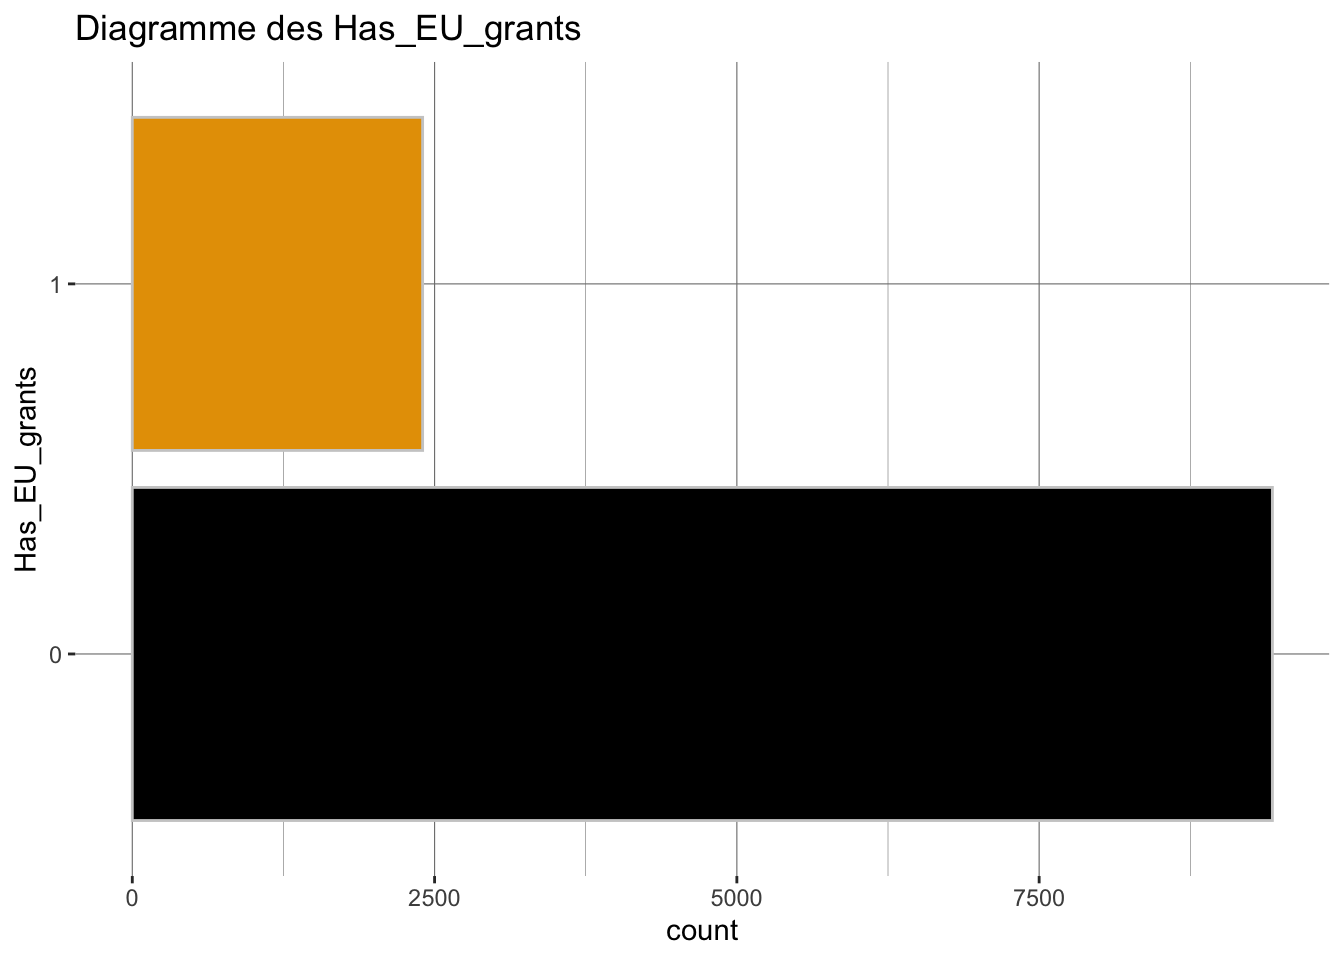
| Has_EU_grants | |
| 0 | 9,429 (80%) |
| 1 | 2,401 (20%) |
| 1 n (%) | |
| Characteristic | 0 N = 9,7851 |
1 N = 2,0451 |
p-value2 |
|---|---|---|---|
| Has_EU_grants | <0.001 | ||
| 0 | 8,051 (82%) | 1,378 (67%) | |
| 1 | 1,734 (18%) | 667 (33%) | |
| 1 n (%) | |||
| 2 Pearson’s Chi-squared test | |||
                  OR  2.5 % 97.5 %         p
Fisher's test 2.2472 2.0177 2.5015 < 2.2e-16 ***
---
Signif. codes:  0 '***' 0.001 '**' 0.01 '*' 0.05 '.' 0.1 ' ' 1
Le chargement a nécessité le package : carDatalattice theme set by effectsTheme()
See ?effectsTheme for details.Resized limits to included dashed line in forest panelWarning in recalculate_width_panels(panel_positions, mapped_text = mapped_text,
: Unable to resize forest panel to be smaller than its heading; consider a
smaller text size`height` was translated to `width`.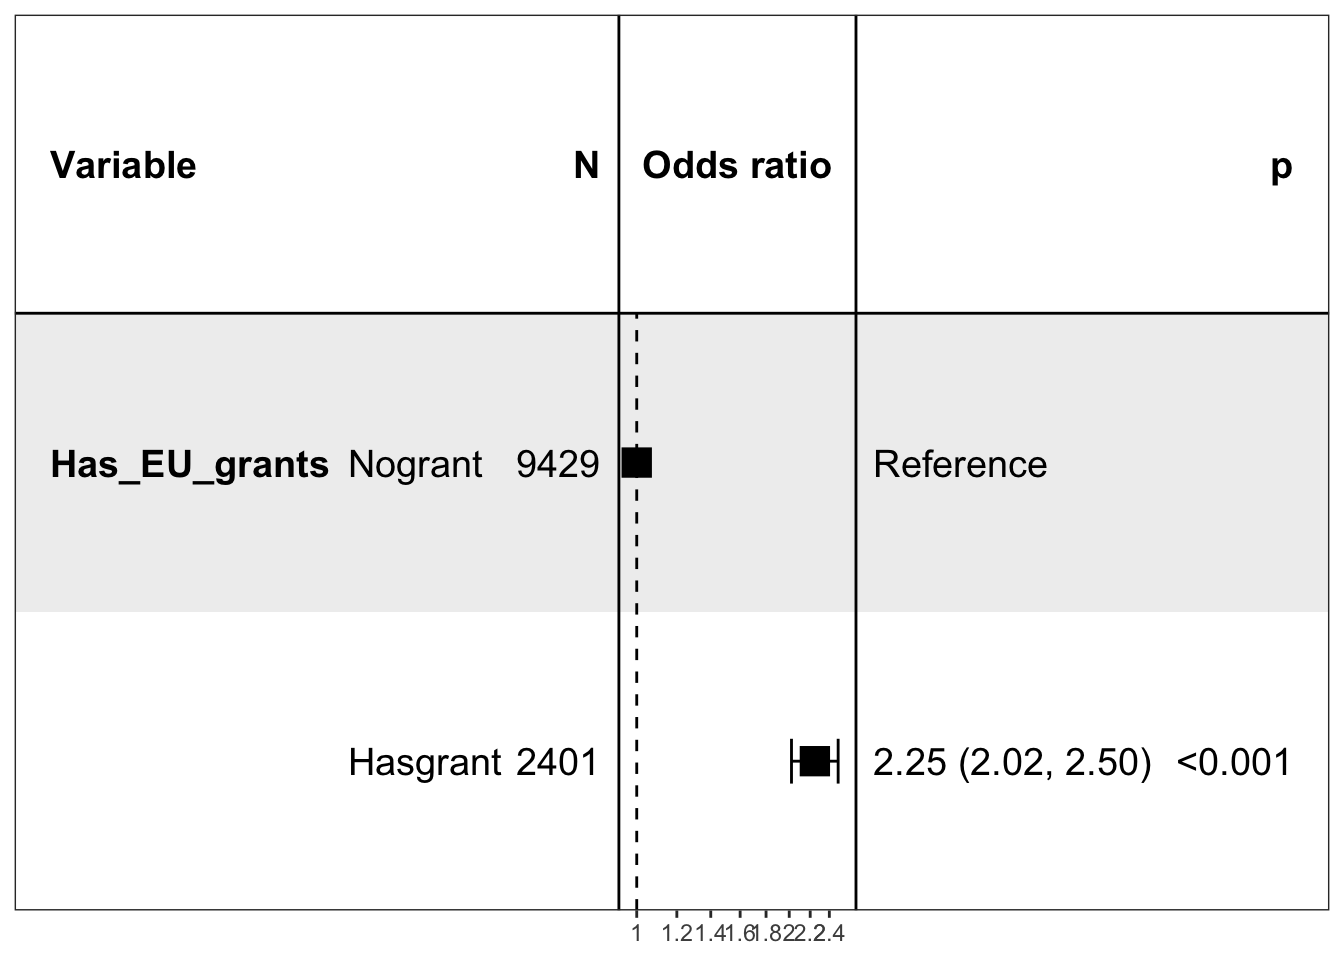
| Nombre de rendez-vous avec la Commission | |
| Characteristic | N = 11,8301 |
|---|---|
| RECO_Meetings | |
| 0 | 8,363 (71%) |
| 1 | 1,336 (11%) |
| 2 | 520 (4.4%) |
| 3 | 319 (2.7%) |
| 4-5 | 345 (2.9%) |
| 6-10 | 409 (3.5%) |
| 11-20 | 305 (2.6%) |
| 20 et + | 233 (2.0%) |
| 1 n (%) | |
| Proportion d'organisation ayant eu un meeting par rapport à la participation à un groupe d'expert | ||
| Characteristic | In_EG N = 2,0451 |
Out_EG N = 9,7851 |
|---|---|---|
| Has_Meetings | ||
| Meeting | 889 (43%) | 2,578 (26%) |
| No_meeting | 1,156 (57%) | 7,207 (74%) |
| 1 n (%) | ||
Warning in recalculate_width_panels(panel_positions, mapped_text = mapped_text,
: Unable to resize forest panel to be smaller than its heading; consider a
smaller text size
`height` was translated to `width`.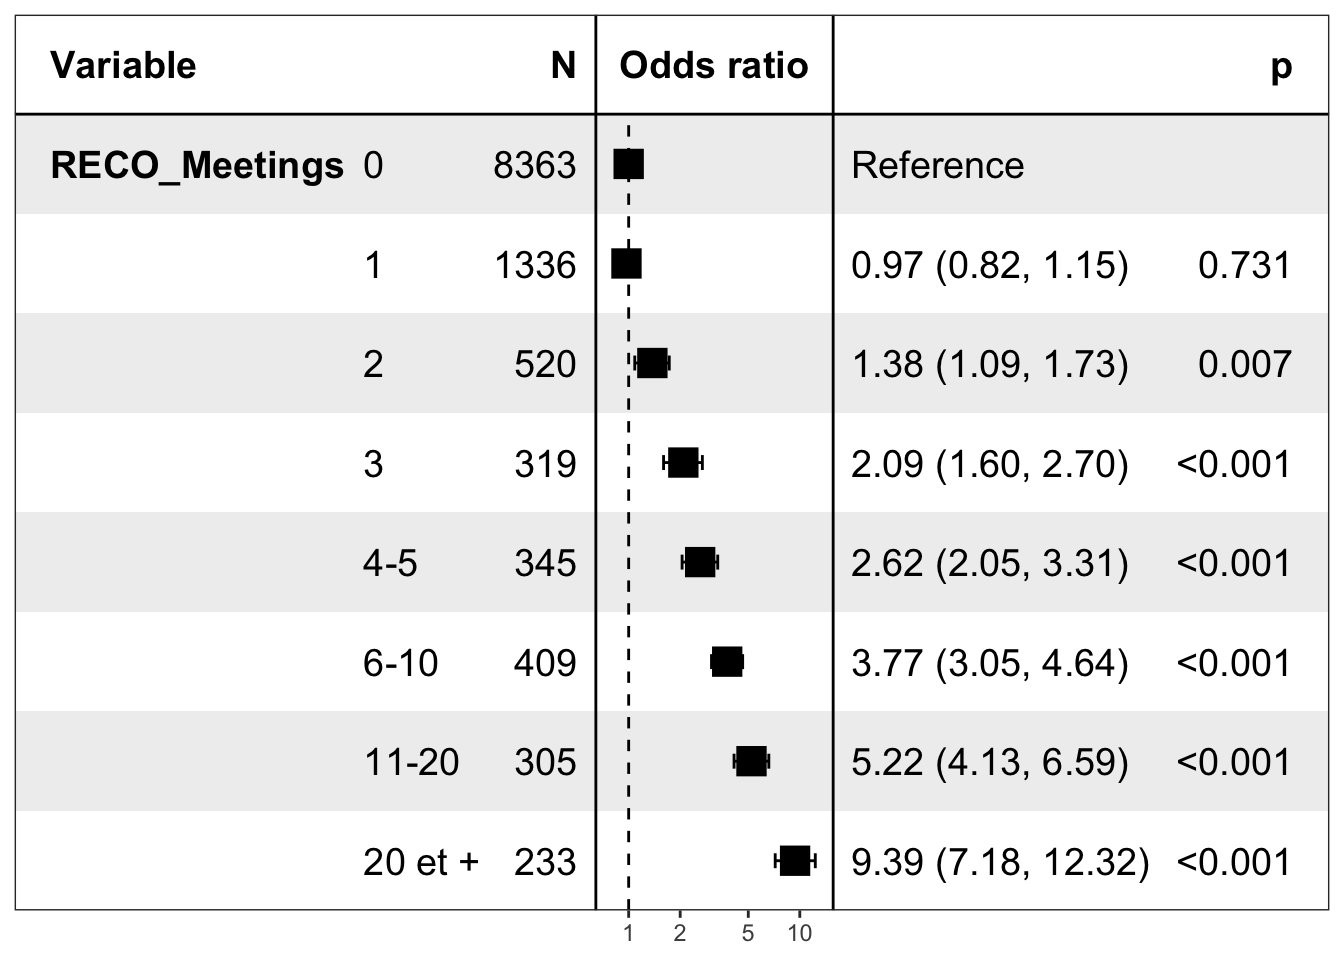
| Characteristic | N = 11,8301 |
|---|---|
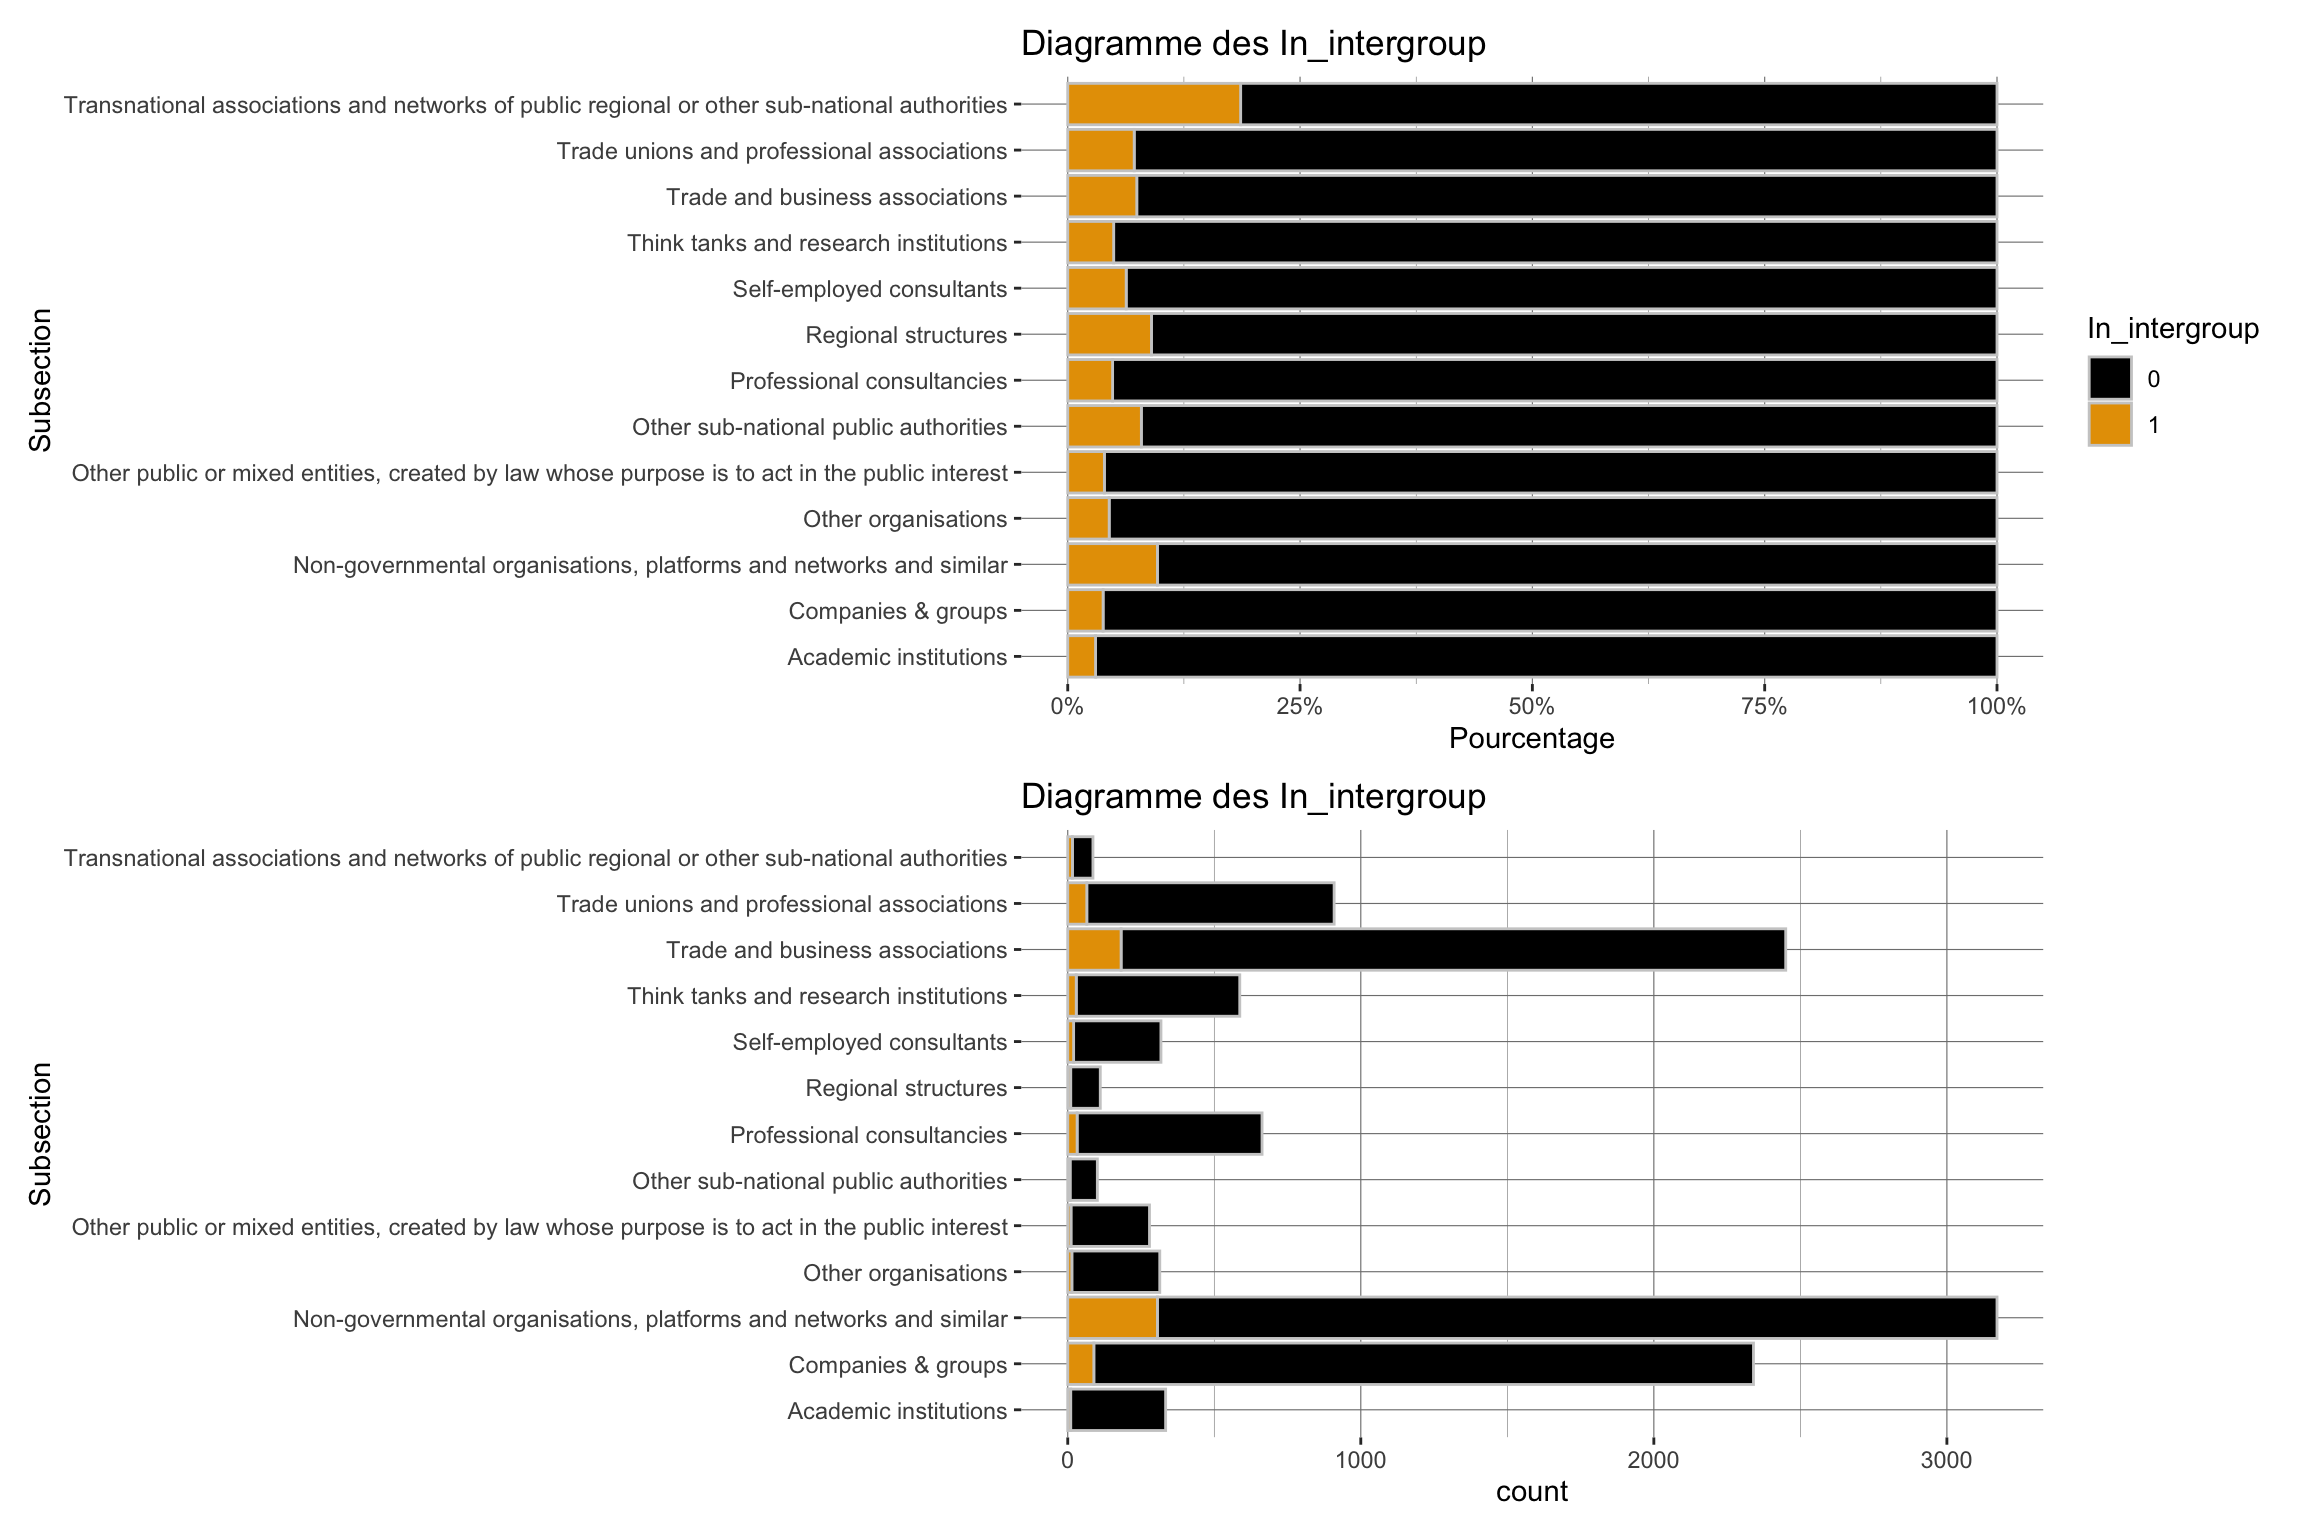
| In_intergroup | |
| 0 | 11,026 (93%) |
| 1 | 804 (6.8%) |
| 1 n (%) | |
| Characteristic | 0 N = 9,7851 |
1 N = 2,0451 |
|---|---|---|
| In_intergroup | ||
| 0 | 9,200 (94%) | 1,826 (89%) |
| 1 | 585 (6.0%) | 219 (11%) |
| 1 n (%) | ||
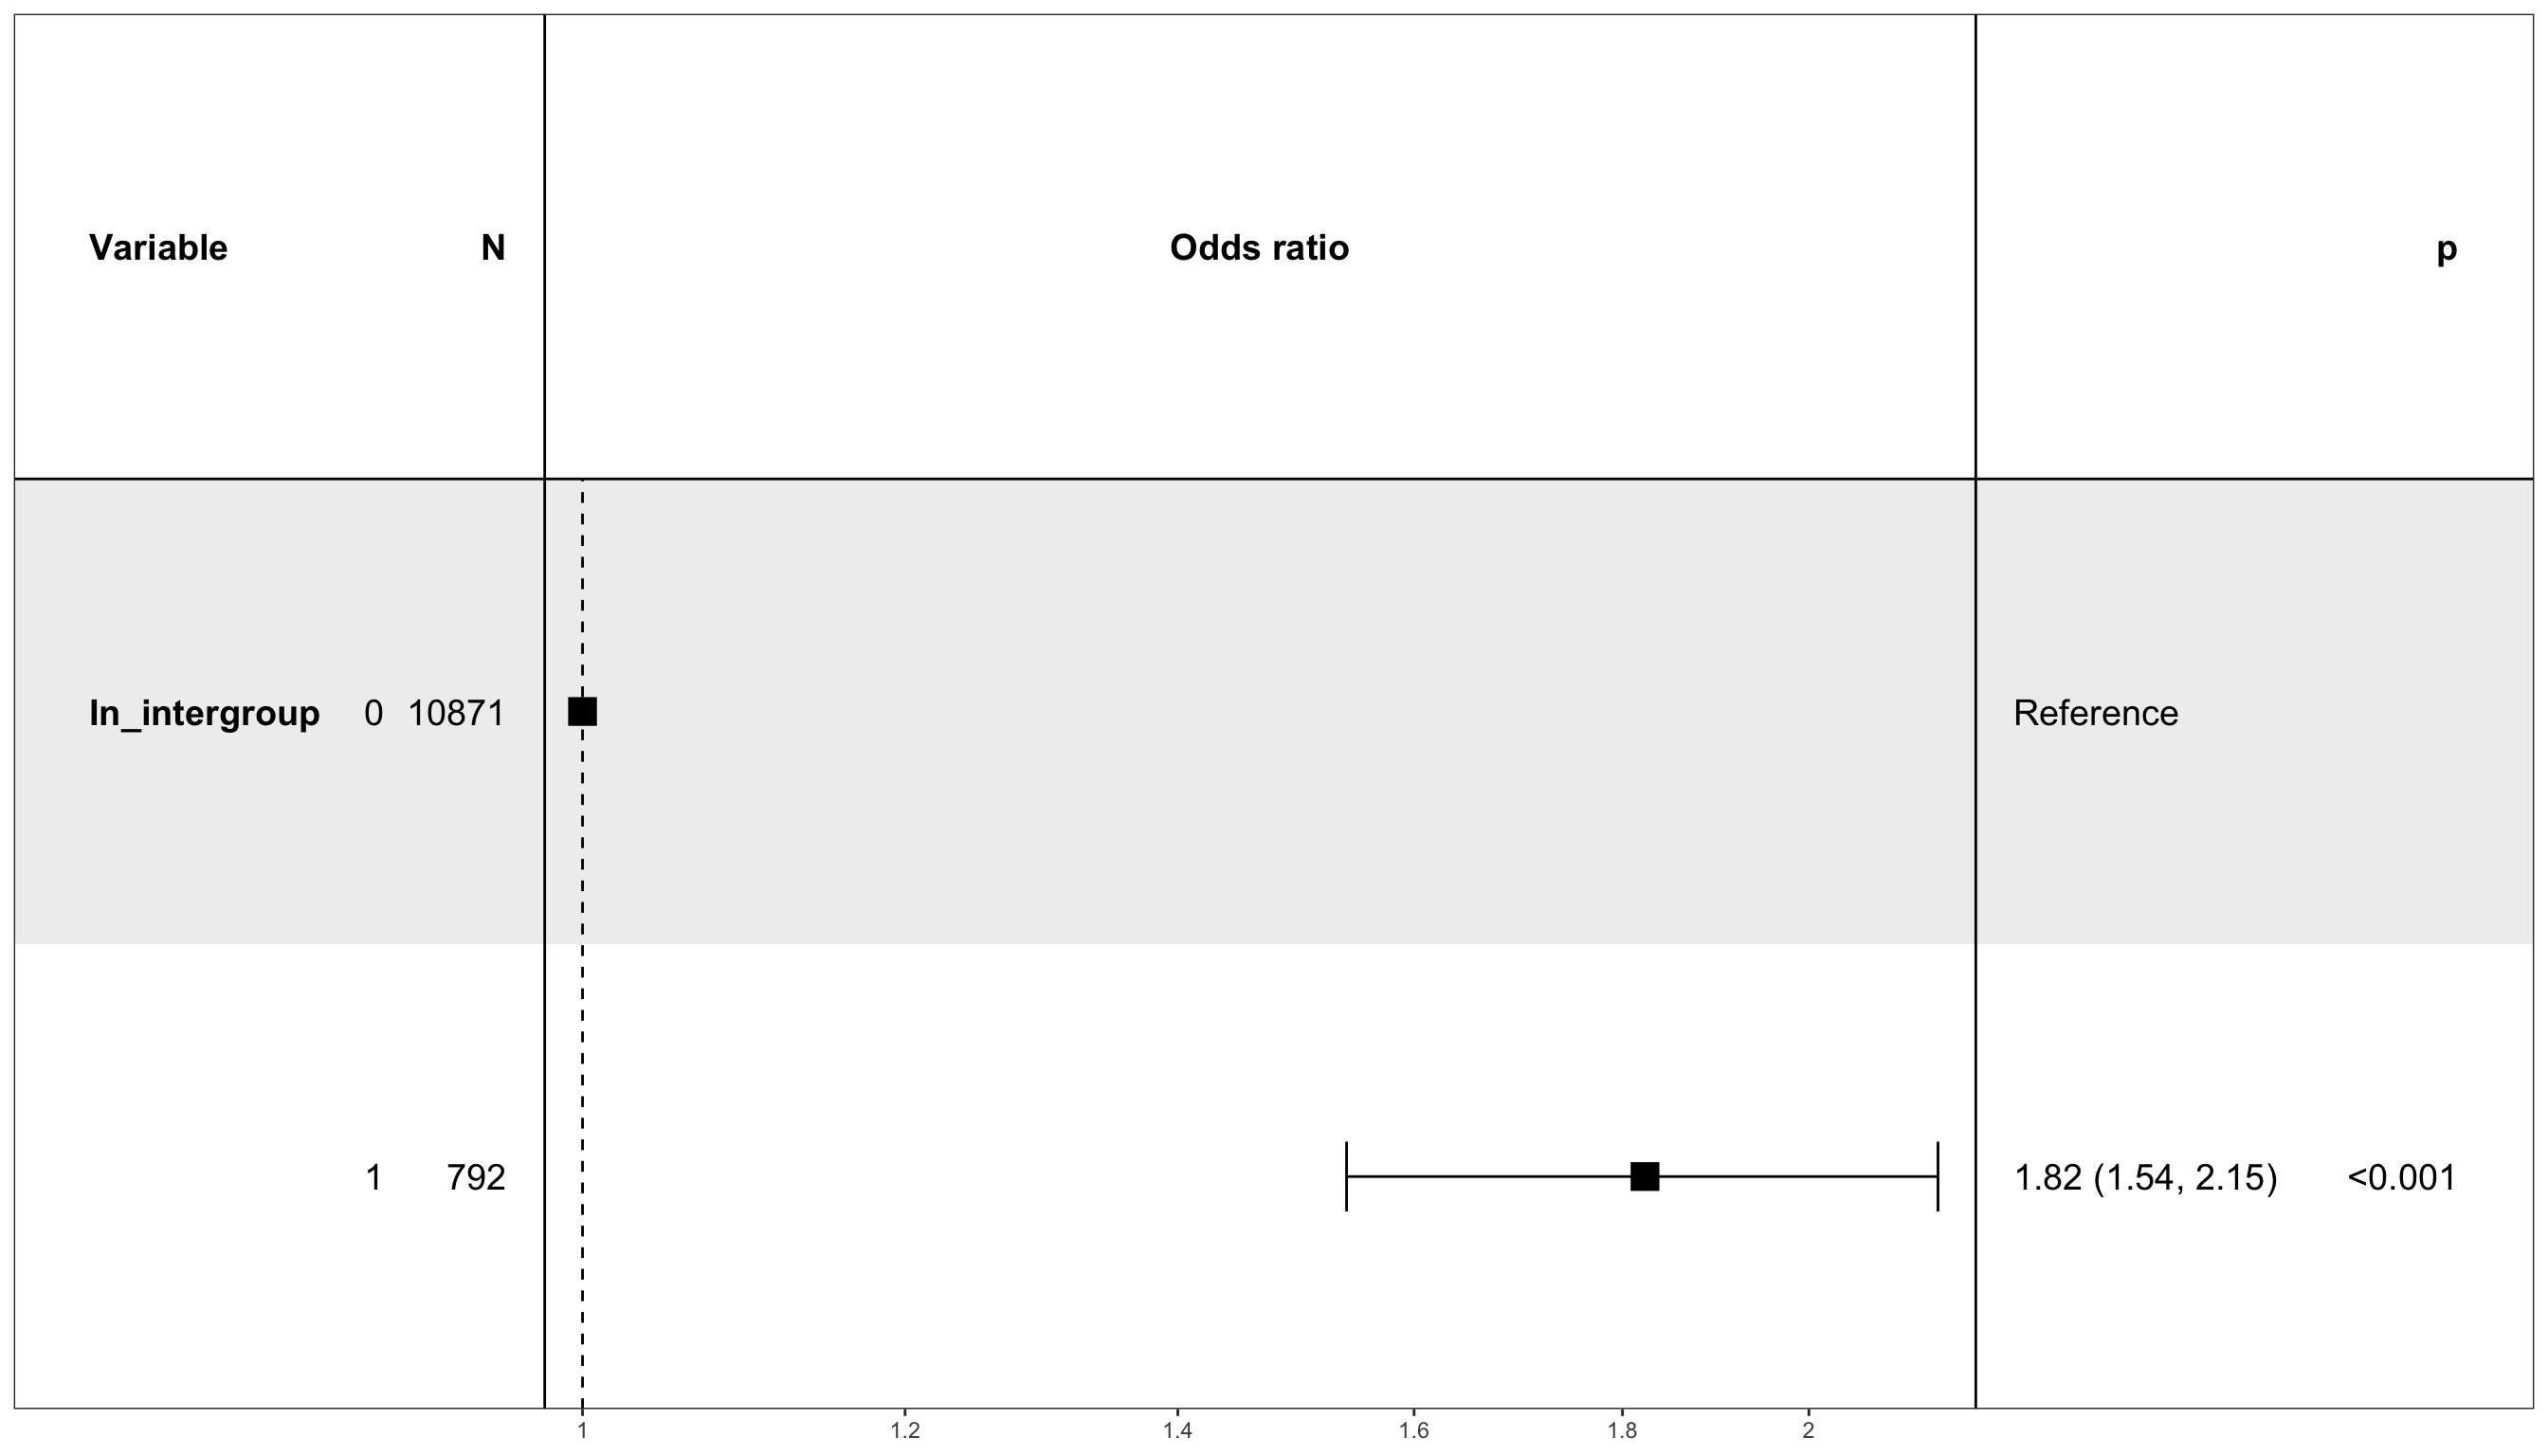
[1] 1.567627e-14 TR19Full$In_intergroup
TR19Full$In_EG 0 1
0 7.73019 -7.73019
1 -7.73019 7.73019 OR 2.5 % 97.5 % p
Fisher's test 1.8861 1.5944 2.2251 2.782e-13 ***
---
Signif. codes: 0 '***' 0.001 '**' 0.01 '*' 0.05 '.' 0.1 ' ' 1Resized limits to included dashed line in forest panel`height` was translated to `width`.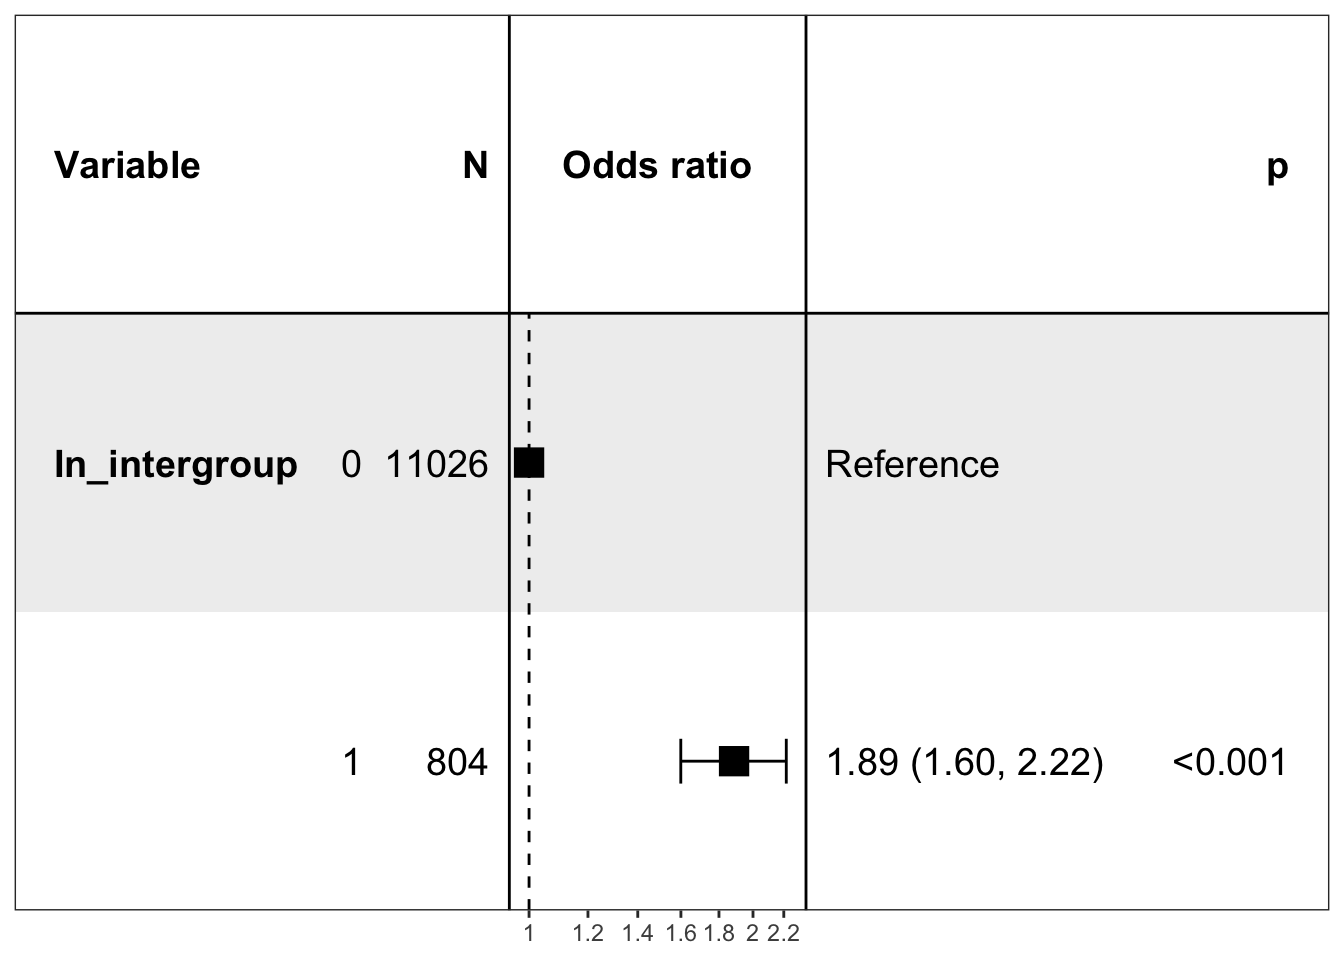
| Type d'organisation | ||
| Dans le registre de transparence de 2019 | ||
| Characteristic | 0 N = 9,7851 |
1 N = 2,0451 |
|---|---|---|
| Subsection | ||
| Academic institutions | 268 (2.7%) | 66 (3.2%) |
| Companies & groups | 2,008 (21%) | 332 (16%) |
| Law firms | 103 (1.1%) | 11 (0.5%) |
| Non-governmental organisations, platforms and networks and similar | 2,596 (27%) | 575 (28%) |
| Organisations representing churches and religious communities | 53 (0.5%) | 0 (0%) |
| Other organisations | 276 (2.8%) | 38 (1.9%) |
| Other public or mixed entities, created by law whose purpose is to act in the public interest | 228 (2.3%) | 51 (2.5%) |
| Other sub-national public authorities | 92 (0.9%) | 9 (0.4%) |
| Professional consultancies | 632 (6.5%) | 31 (1.5%) |
| Regional structures | 100 (1.0%) | 11 (0.5%) |
| Self-employed consultants | 303 (3.1%) | 15 (0.7%) |
| Think tanks and research institutions | 505 (5.2%) | 82 (4.0%) |
| Trade and business associations | 1,818 (19%) | 632 (31%) |
| Trade unions and professional associations | 740 (7.6%) | 169 (8.3%) |
| Transnational associations and networks of public regional or other sub-national authorities | 63 (0.6%) | 23 (1.1%) |
| 1 n (%) | ||
On ne garde pas des analyses suivantes les organisations suivantes :
“Entities, offices or networks established by third countries”
“Self-employed individuals”
“Organisations representing churches and religious communities”
“Law firms”
Parce qu’elles représentent trop peu d’individus, en particulier dans les groupes experts.
`stat_bin()` using `bins = 30`. Pick better value `binwidth`.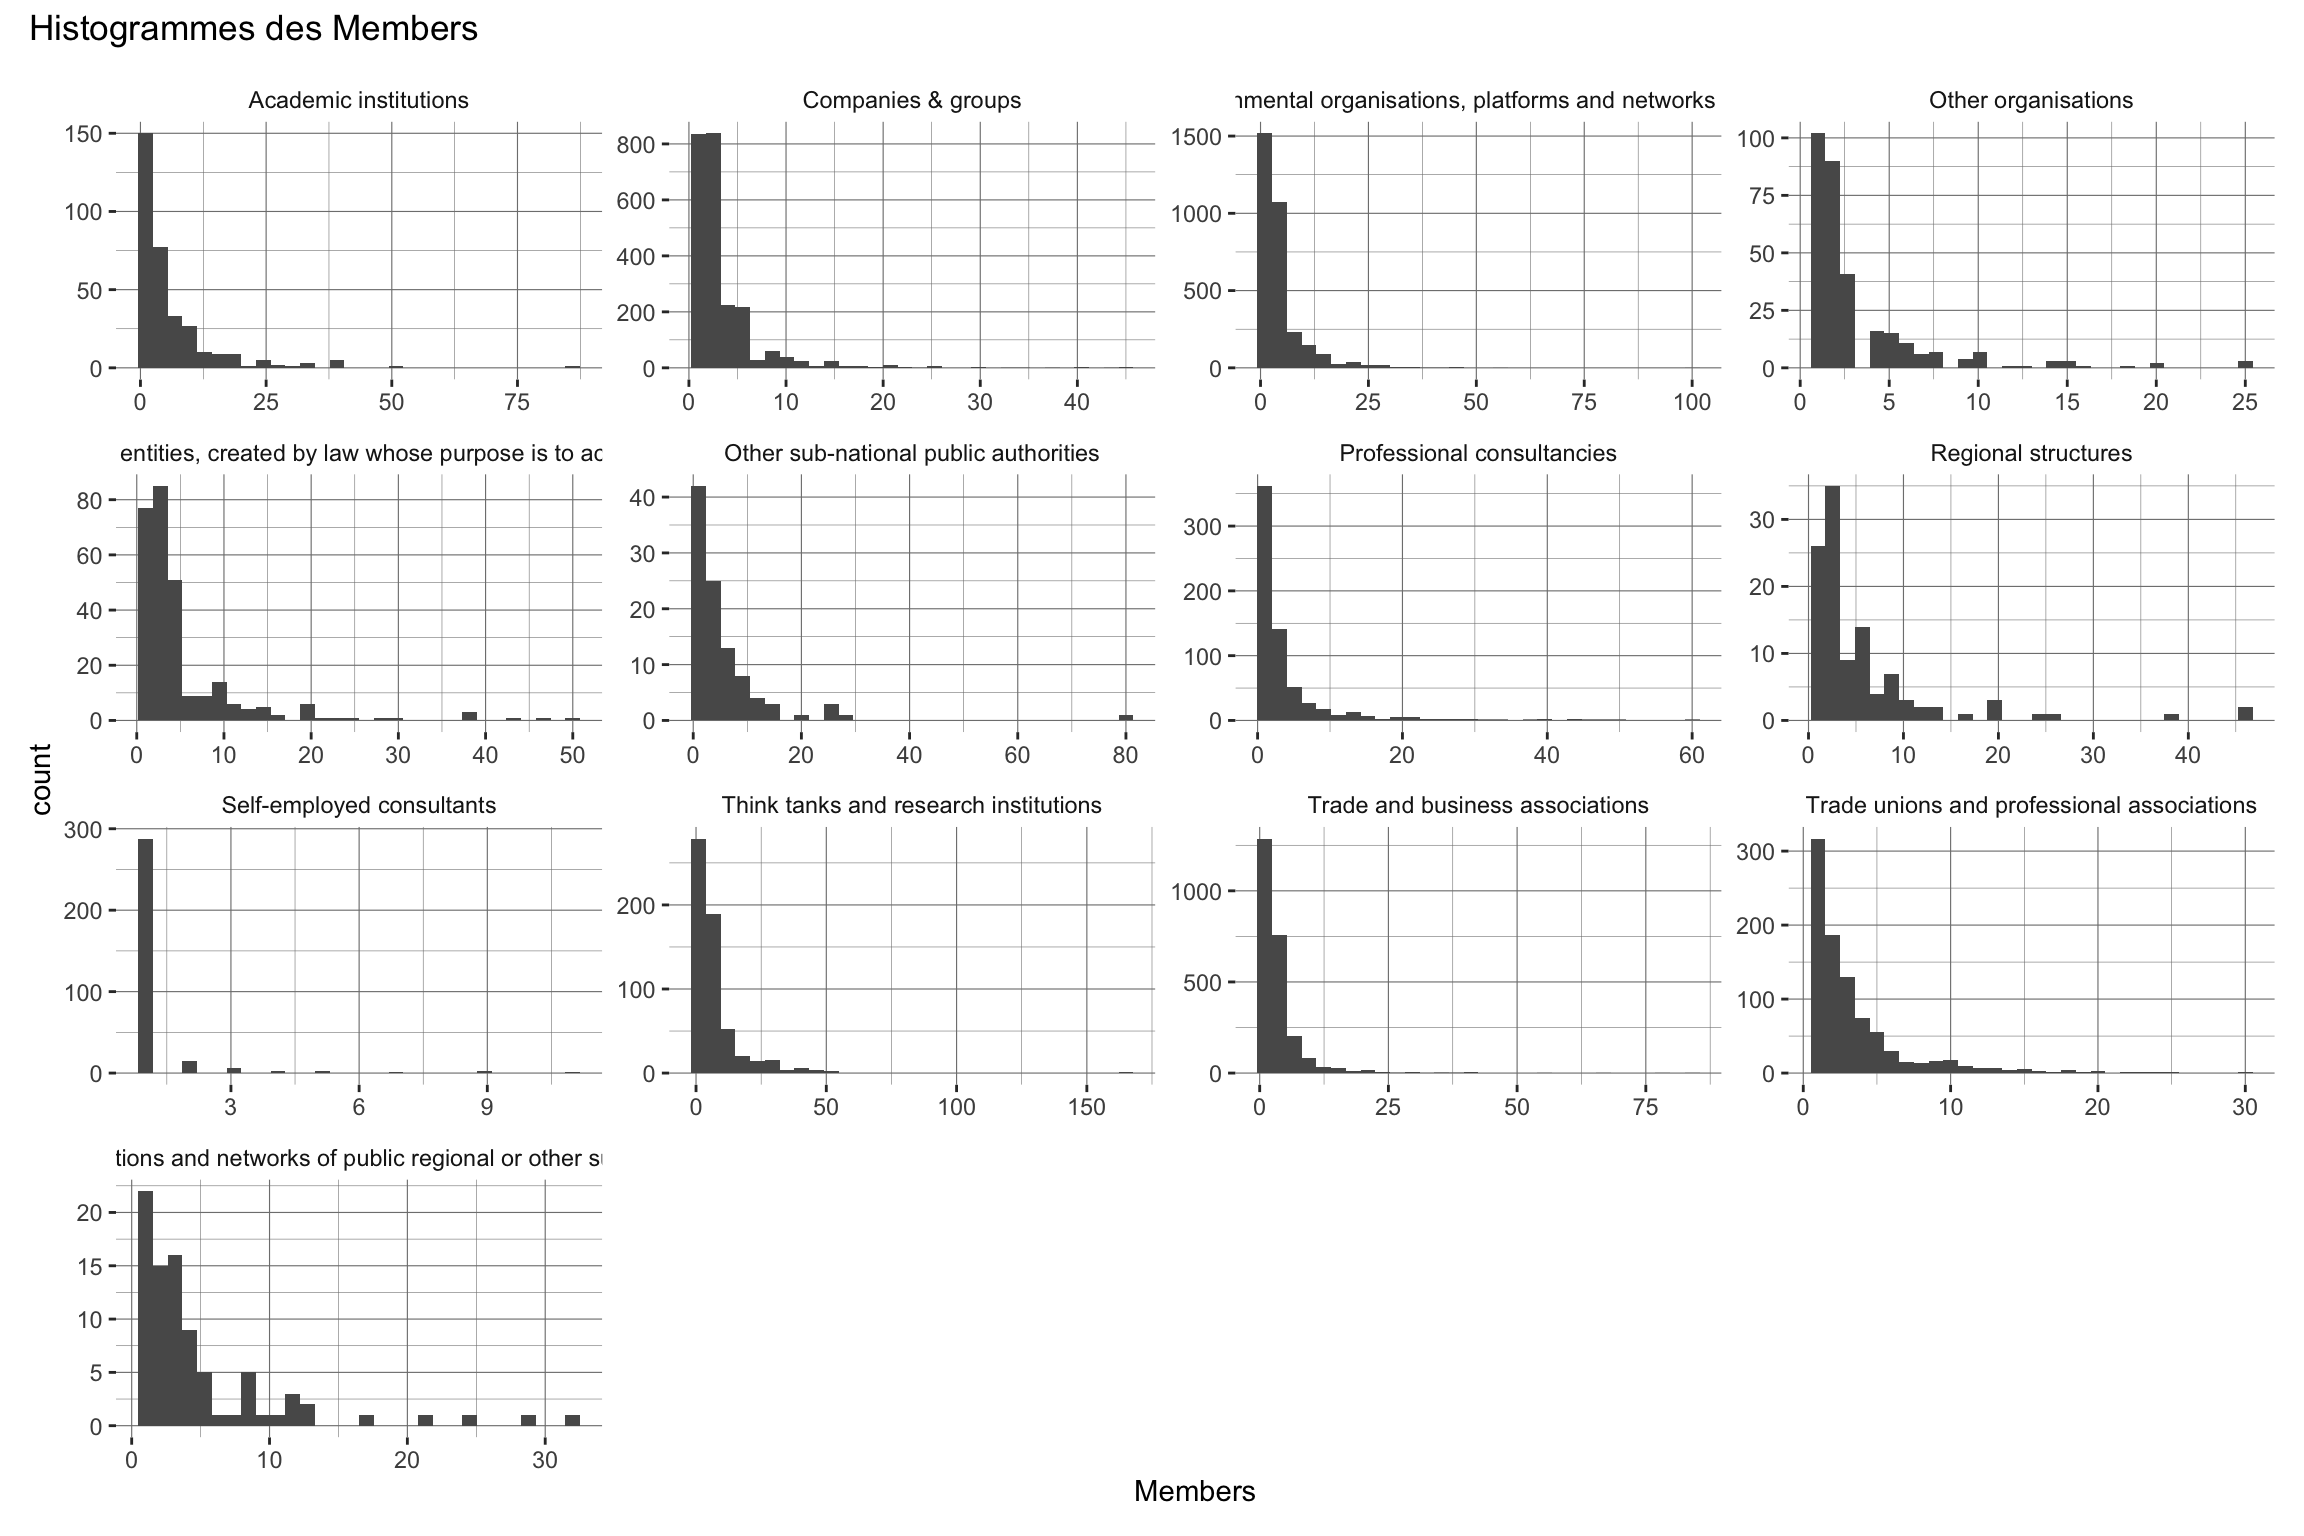
`stat_bin()` using `bins = 30`. Pick better value `binwidth`.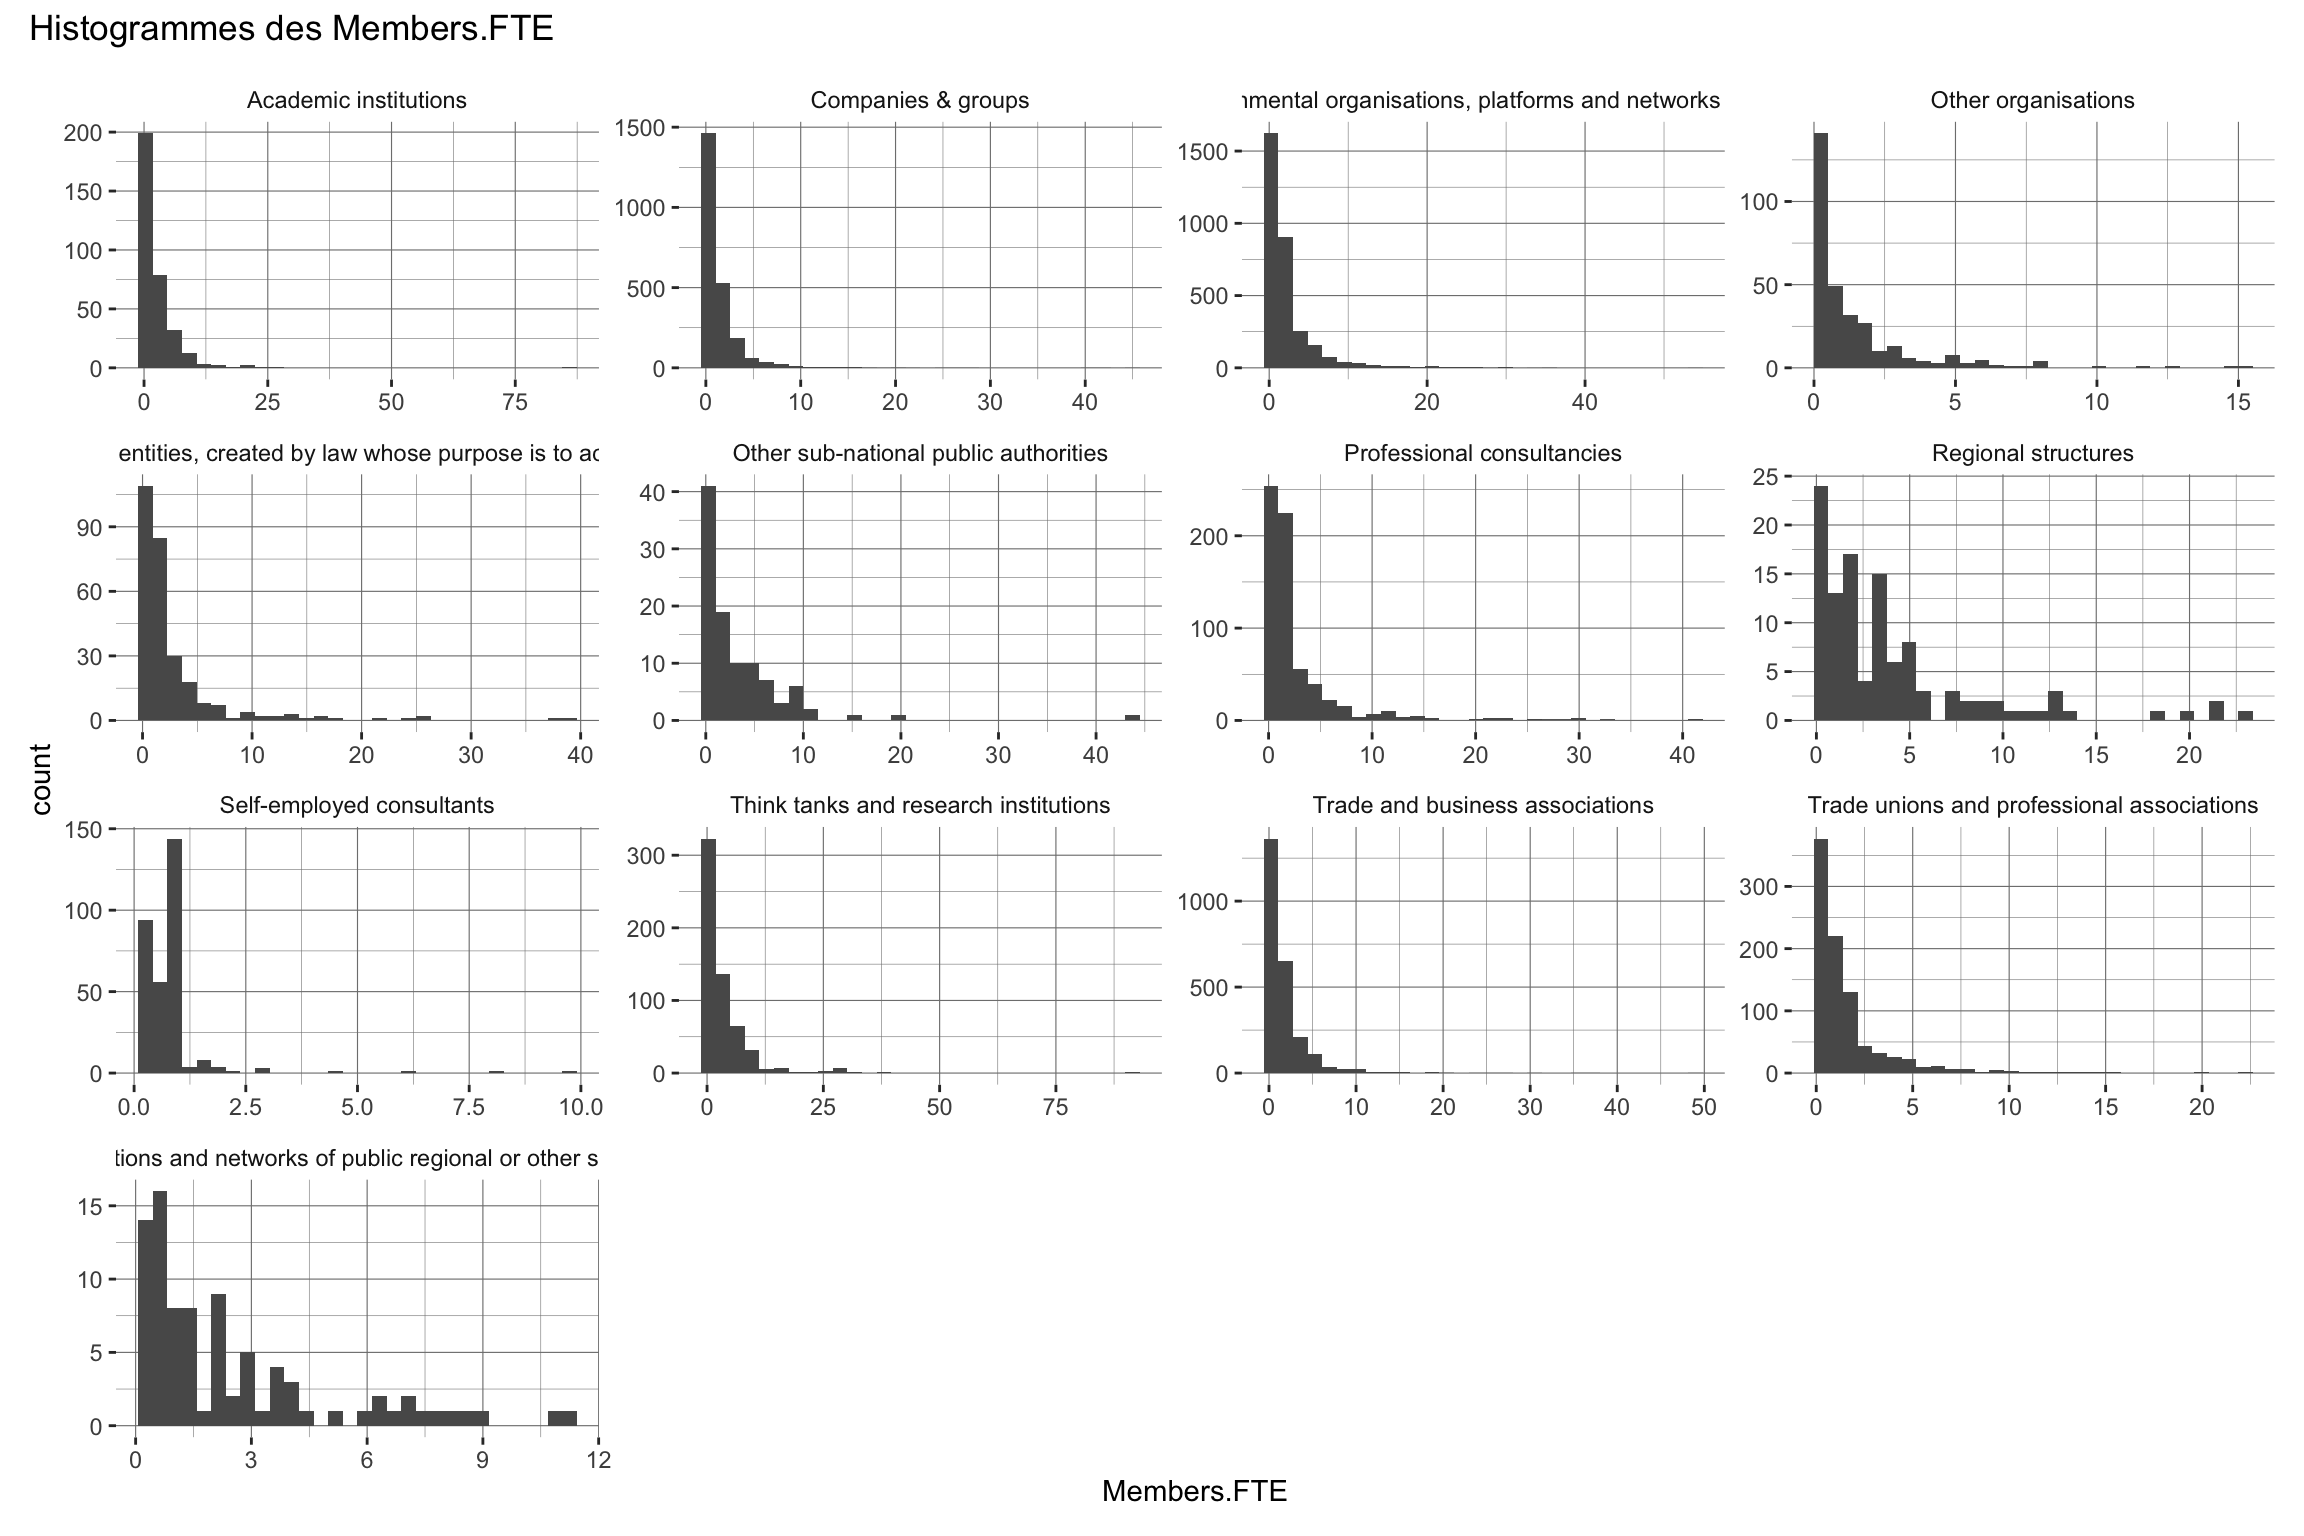
`stat_bin()` using `bins = 30`. Pick better value `binwidth`.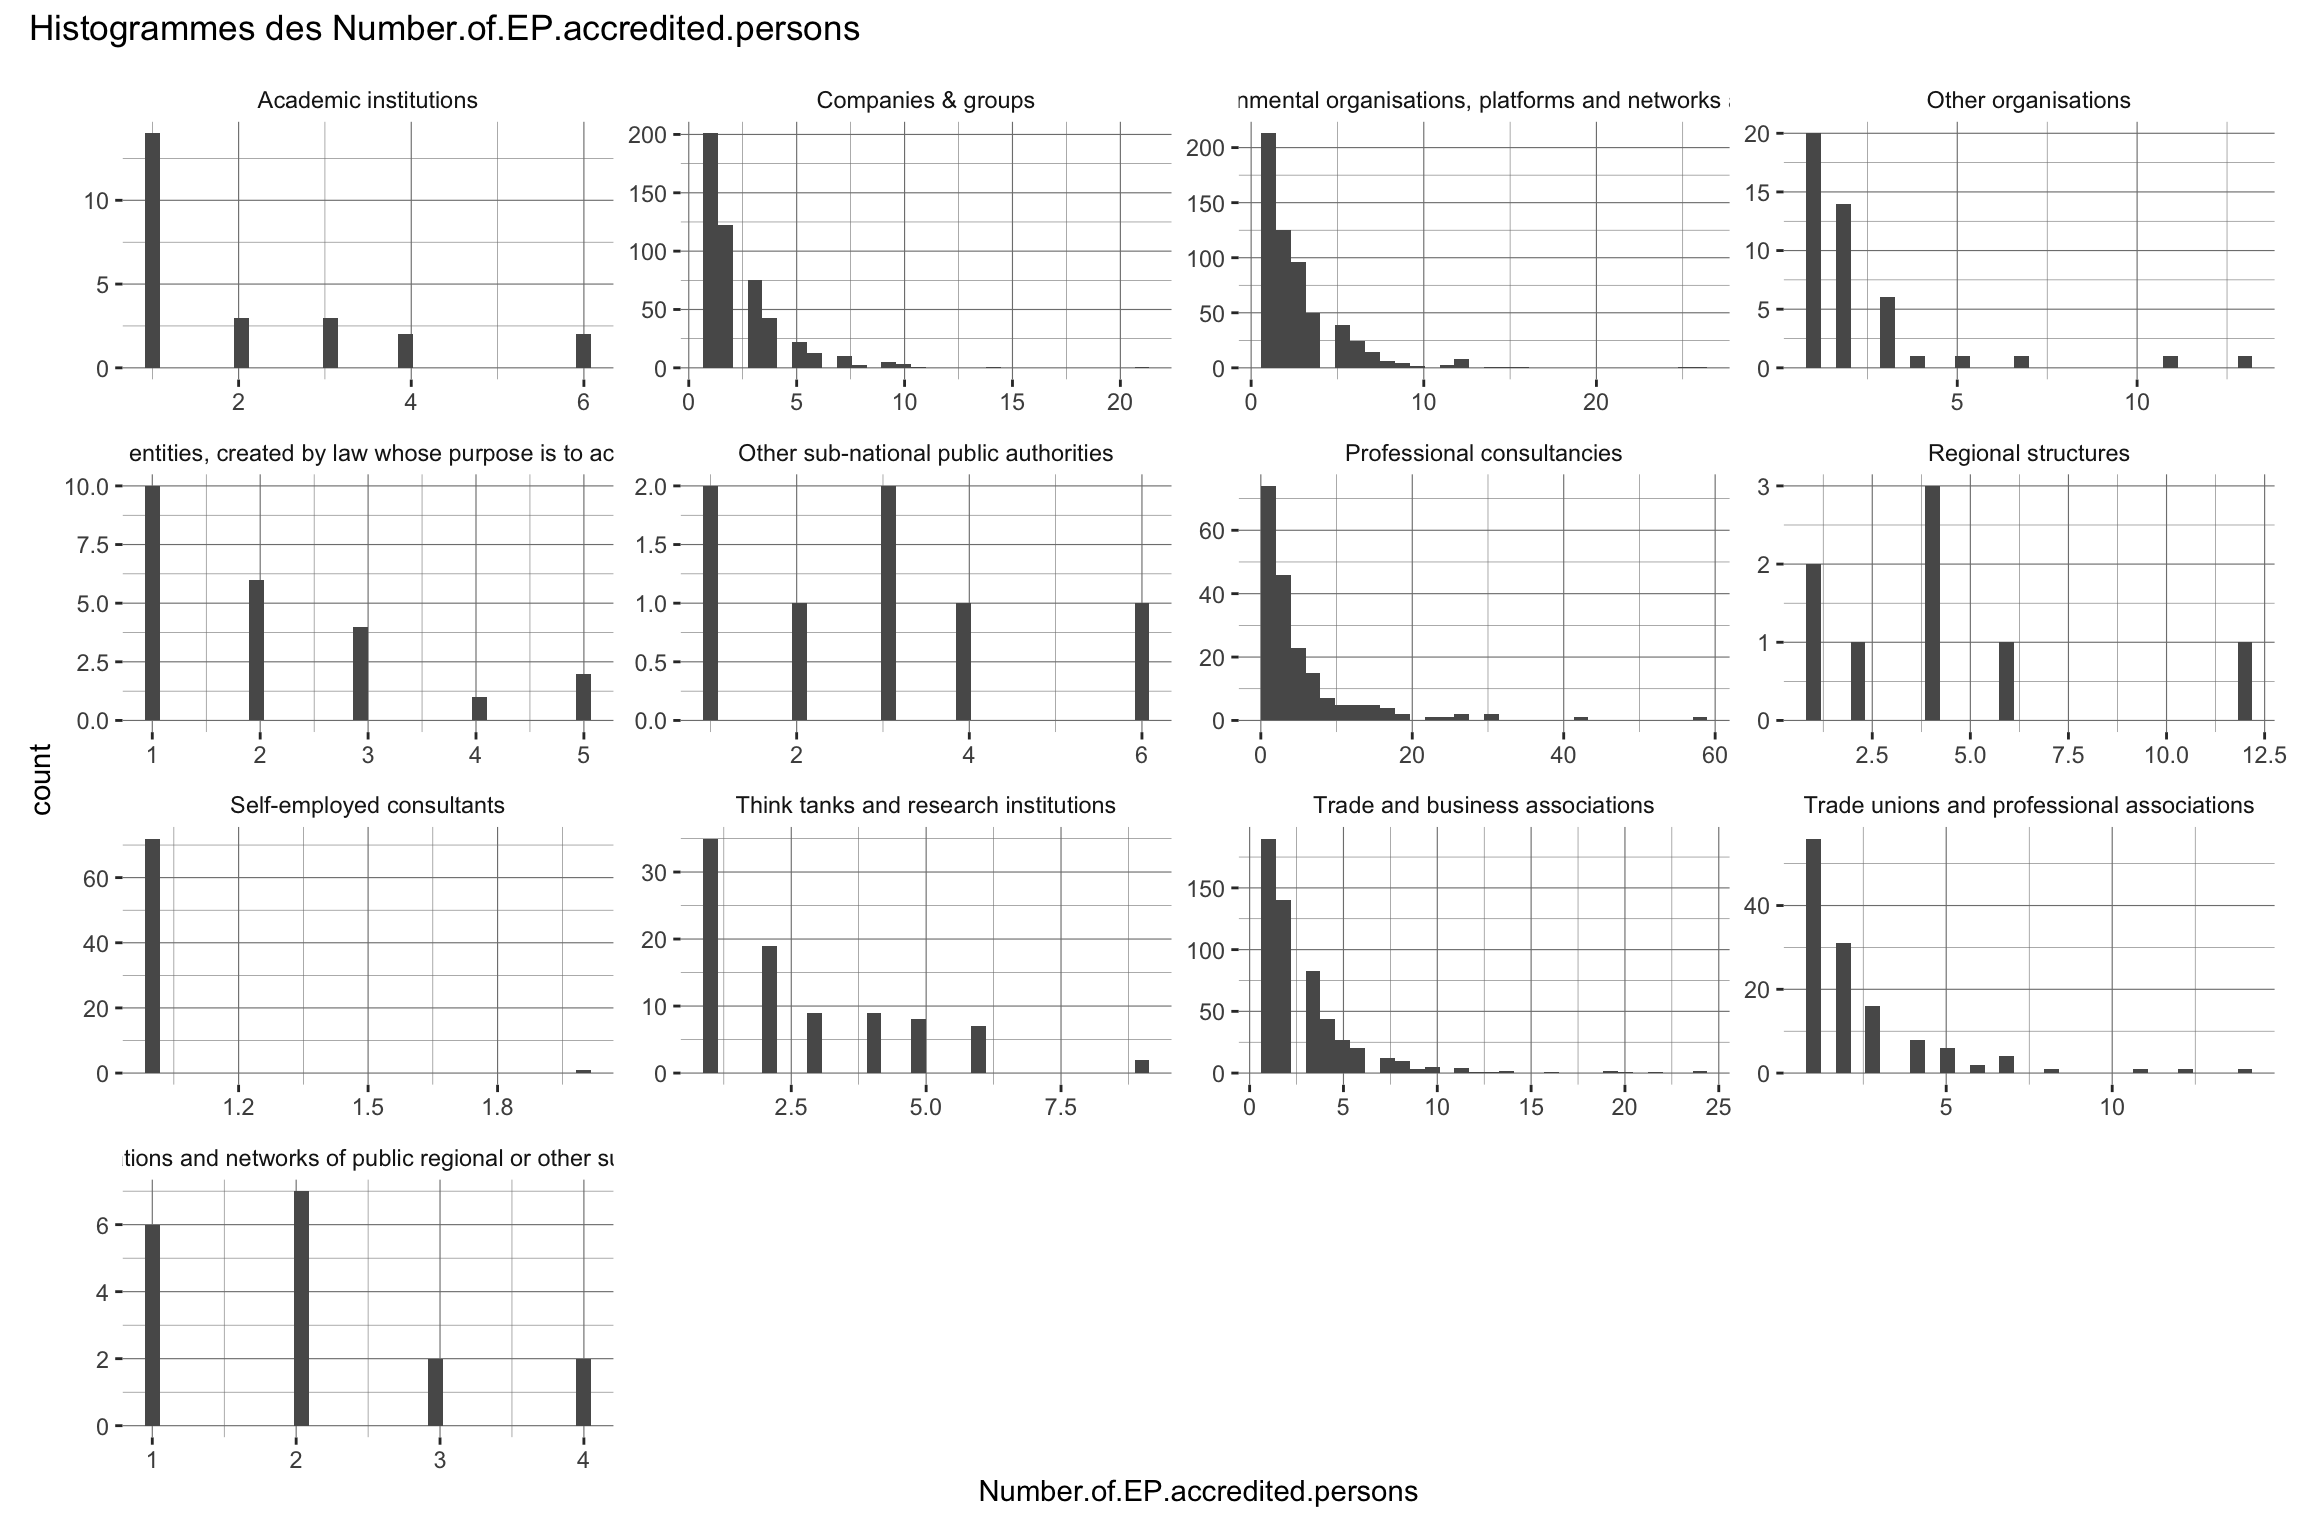
`stat_bin()` using `bins = 30`. Pick better value `binwidth`.
`stat_bin()` using `bins = 30`. Pick better value `binwidth`.
`stat_bin()` using `bins = 30`. Pick better value `binwidth`.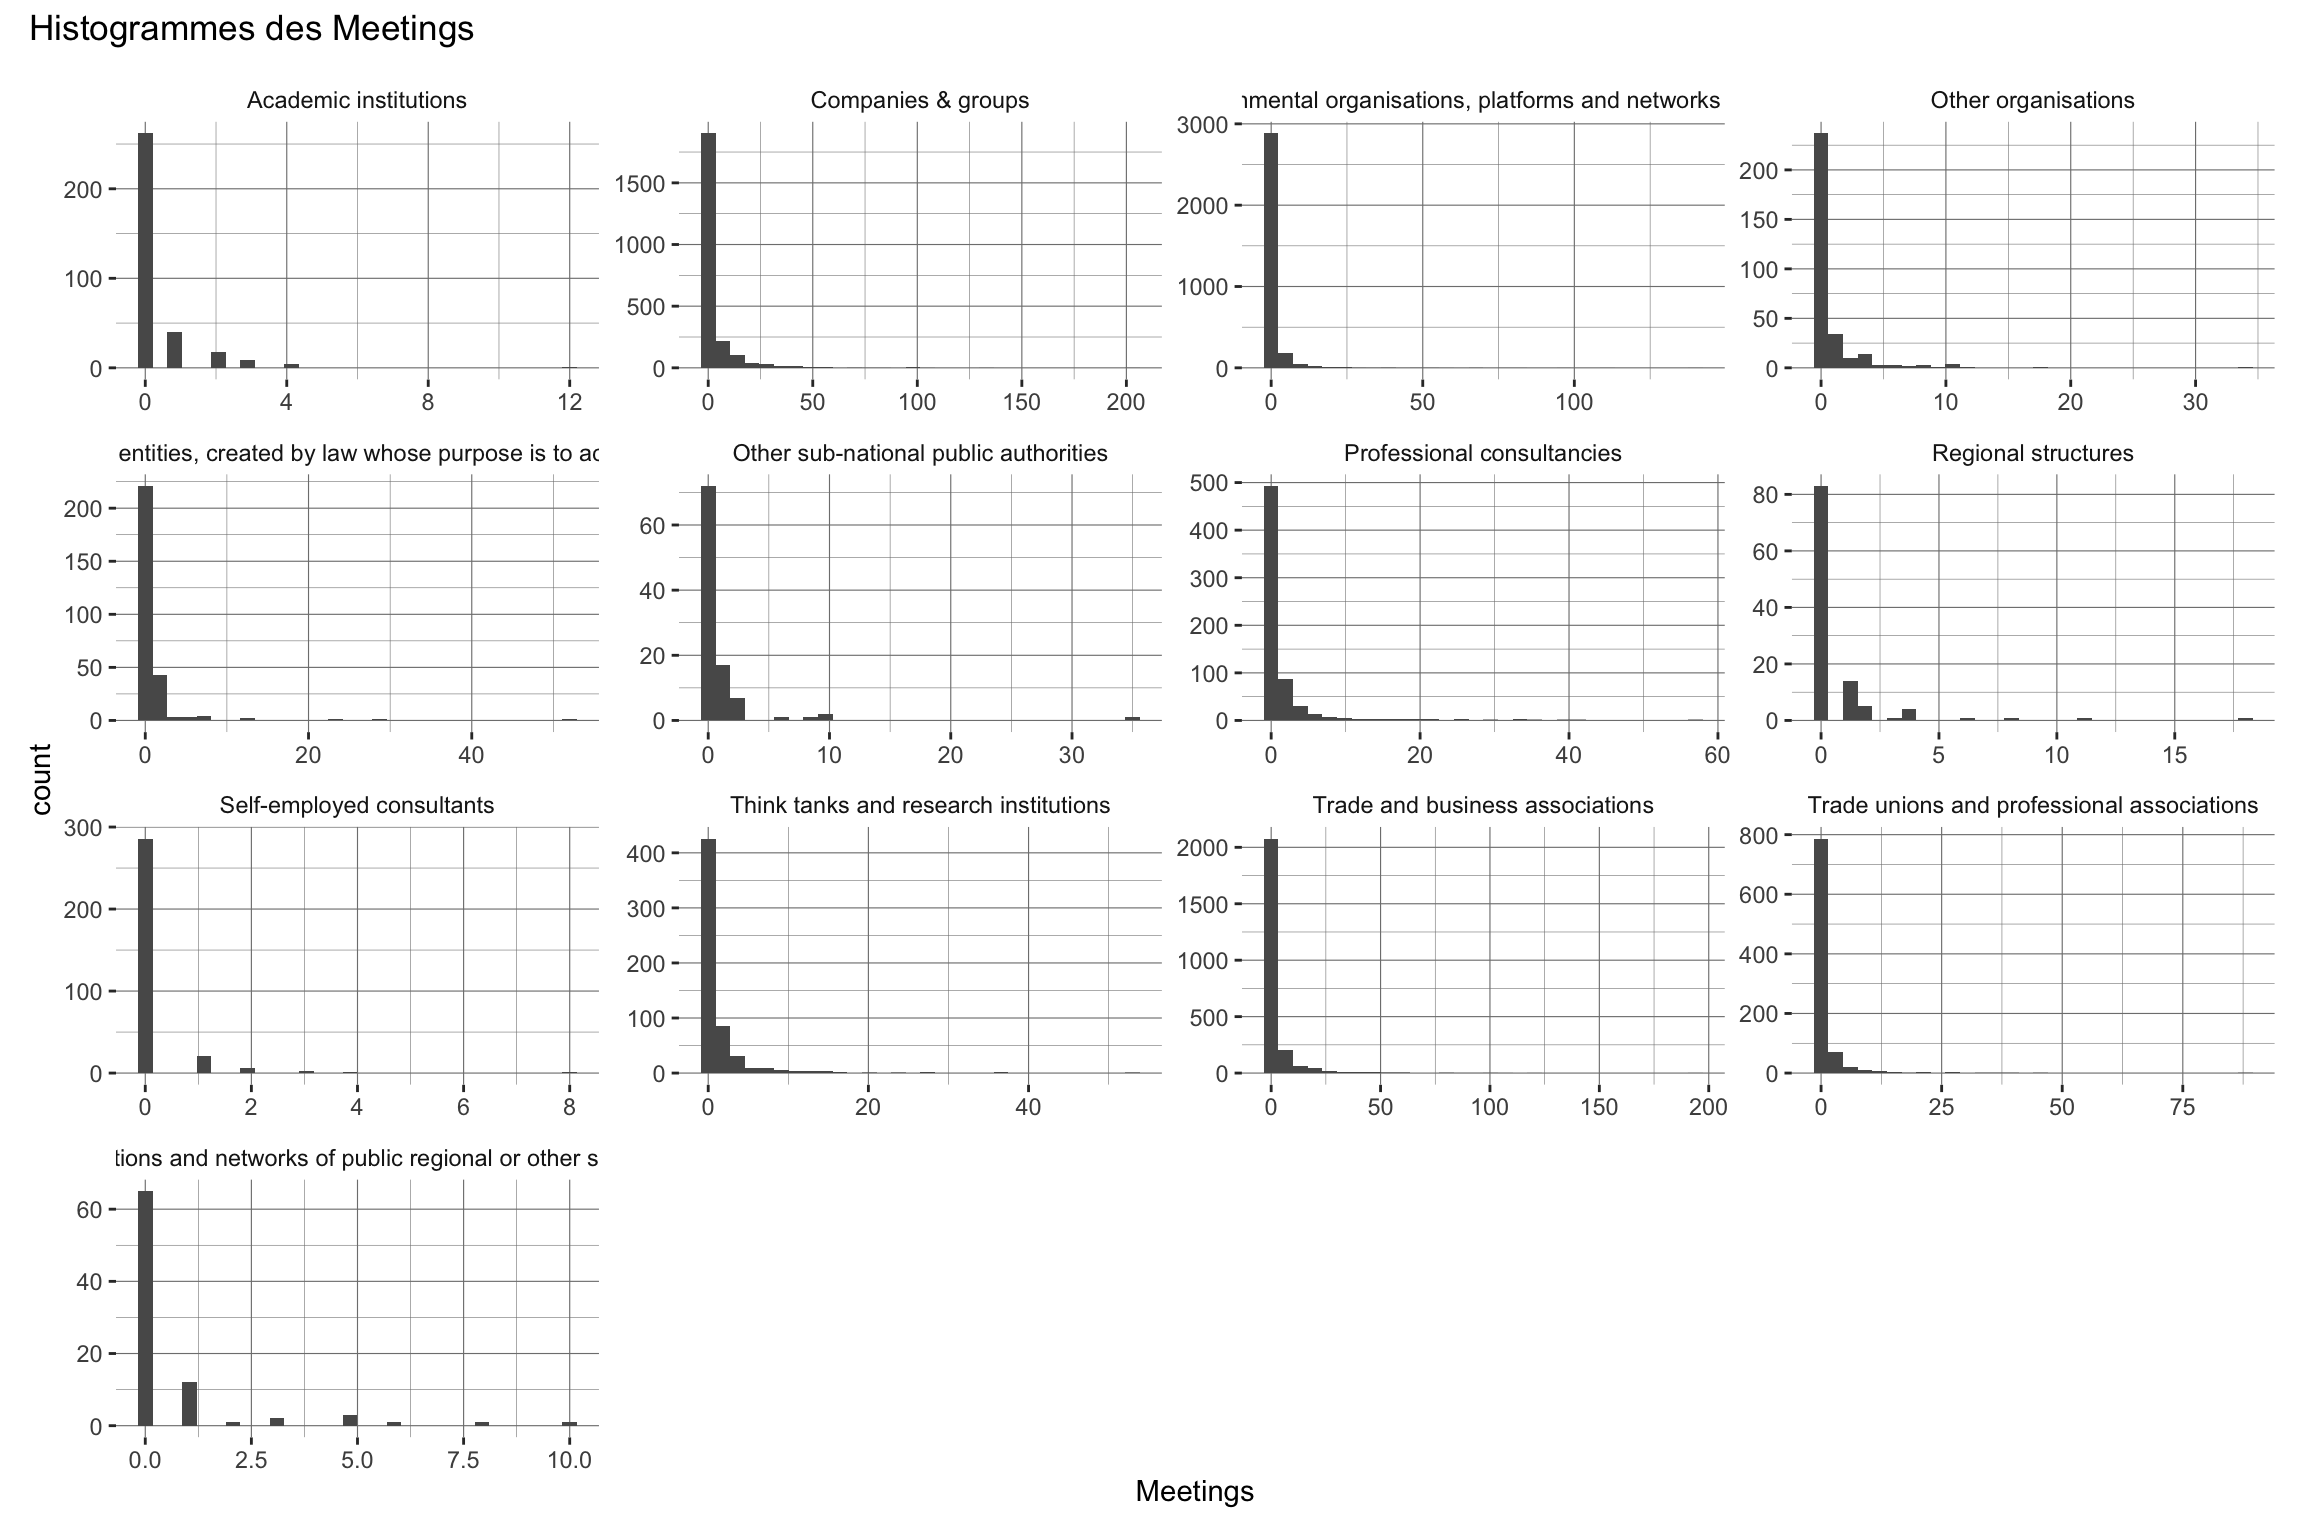
`stat_bin()` using `bins = 30`. Pick better value `binwidth`.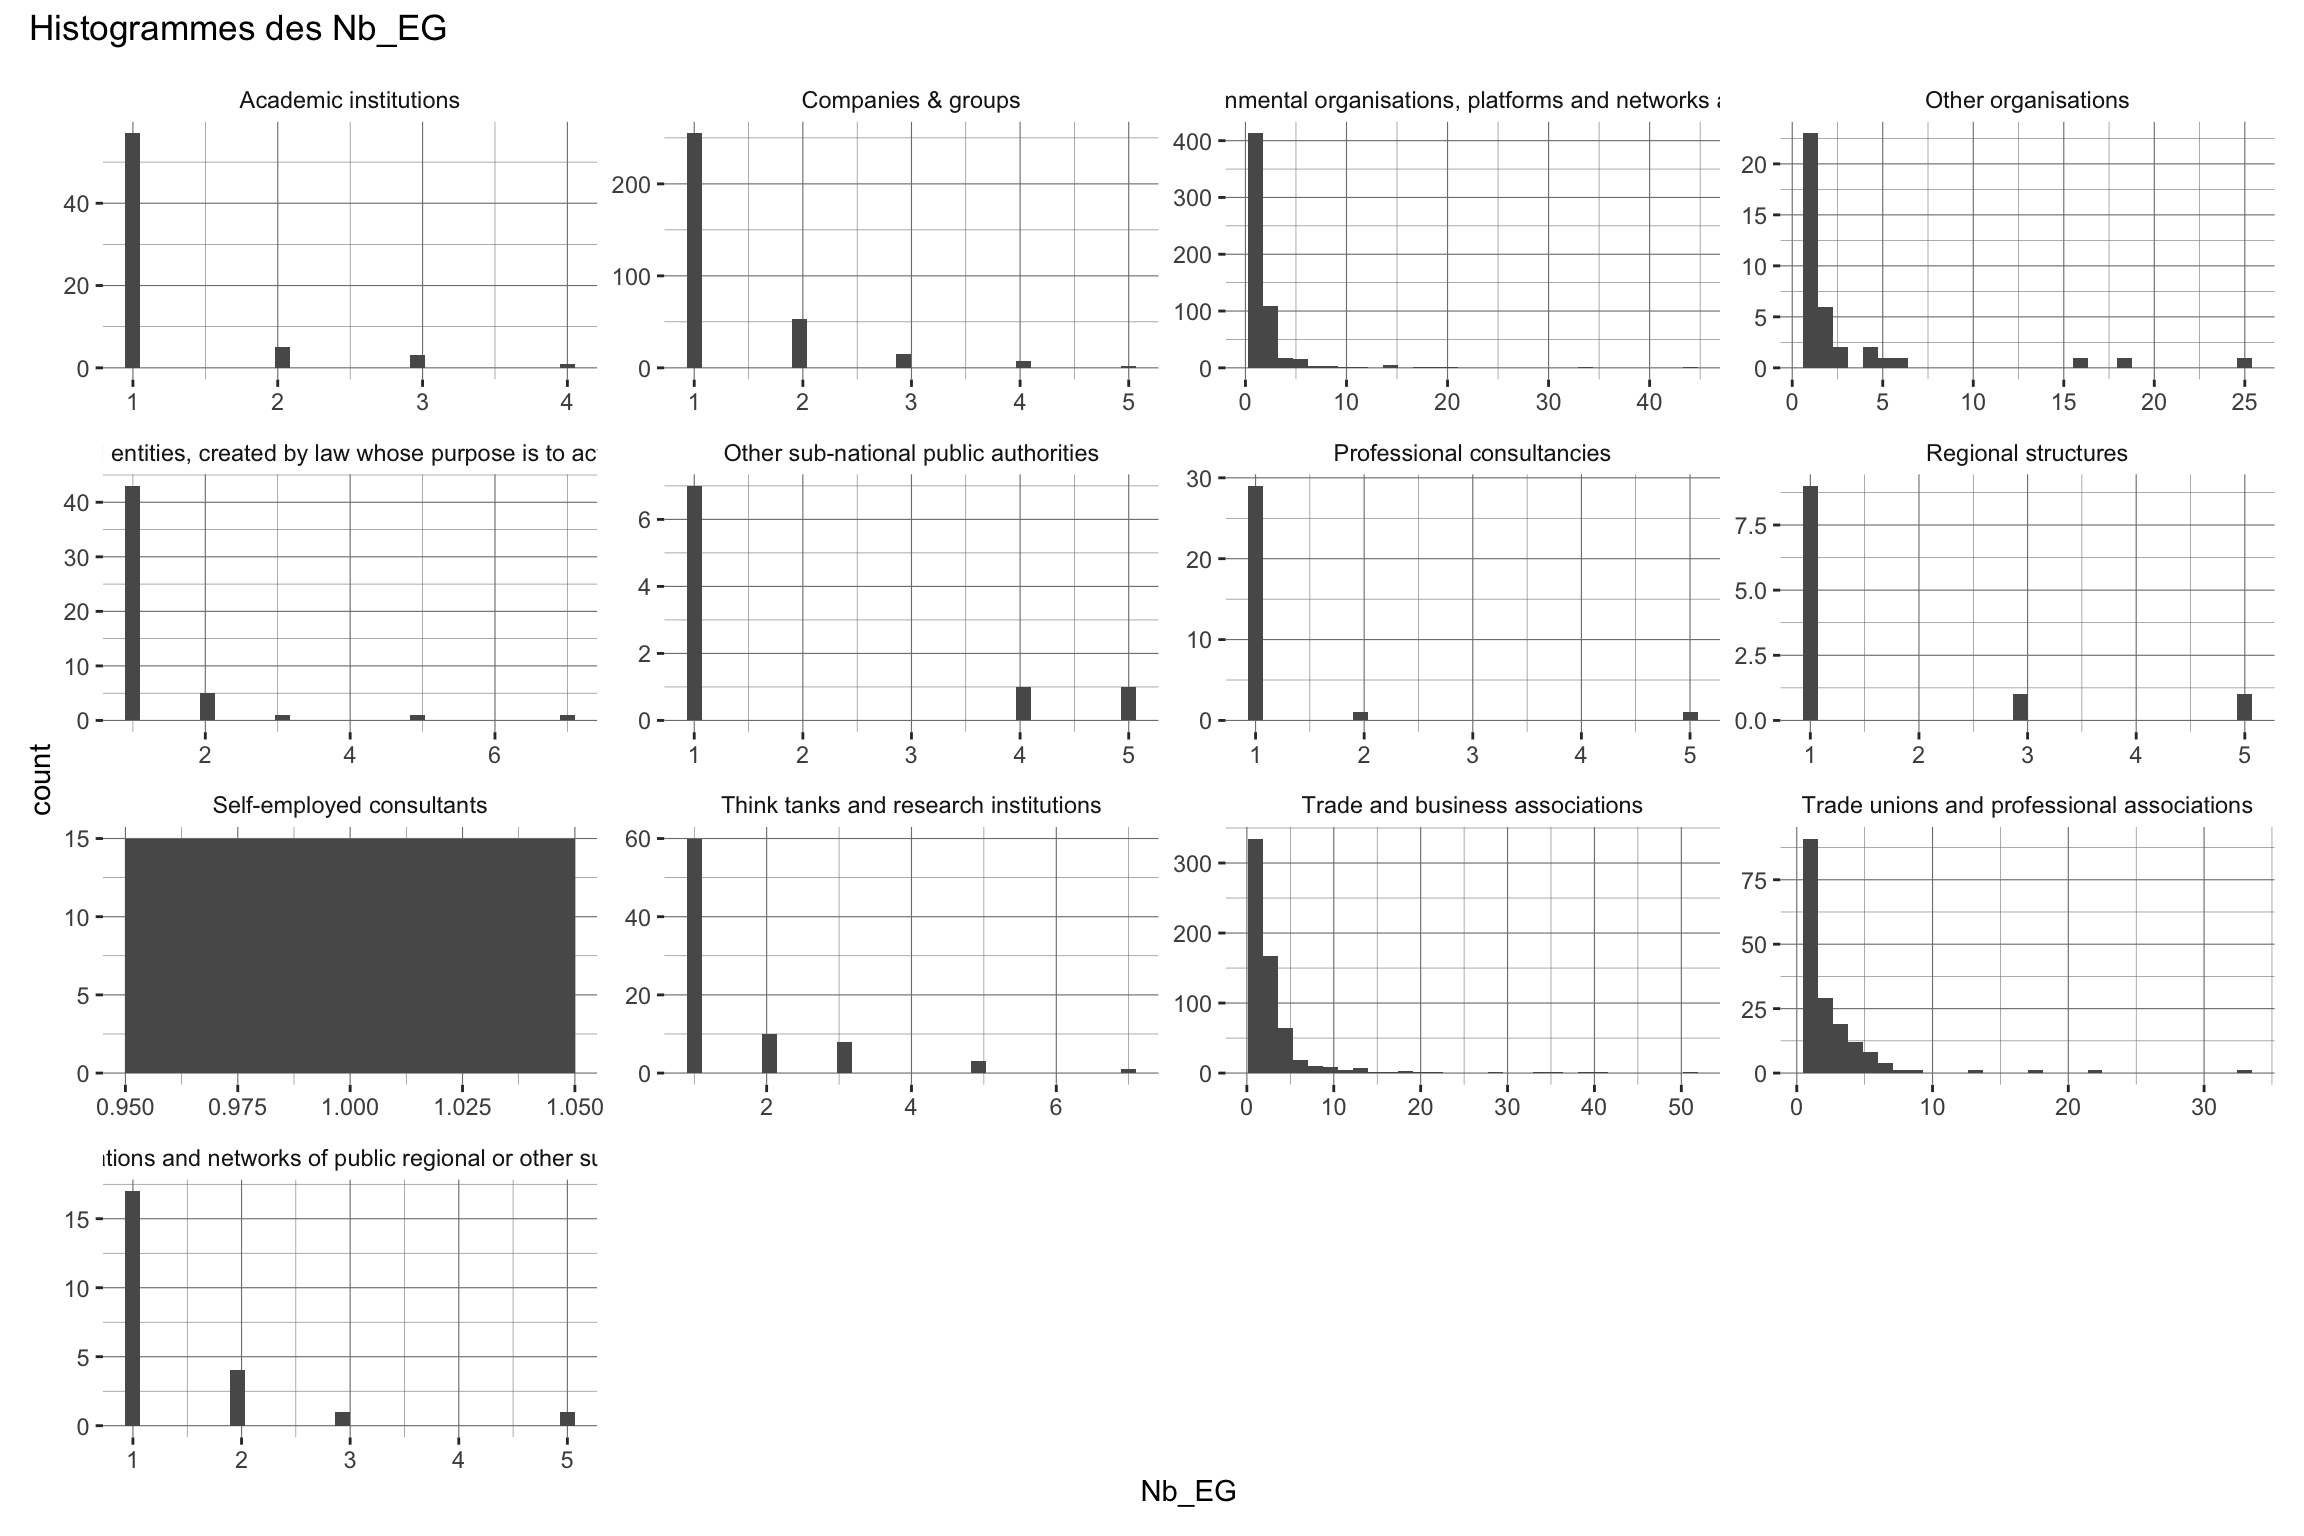
| Subsection | n_ETP | Percent | mean_orga | nb_orga |
|---|---|---|---|---|
| Non-governmental organisations, platforms and networks and similar | 7442.50 | 30.19 | 2.3470514 | 3171 |
| Trade and business associations | 4548.50 | 18.45 | 1.8565306 | 2450 |
| Companies & groups | 3694.50 | 14.99 | 1.5788462 | 2340 |
| Think tanks and research institutions | 2121.25 | 8.61 | 3.6137138 | 587 |
| Professional consultancies | 1881.00 | 7.63 | 2.8371041 | 663 |
| Trade unions and professional associations | 1473.75 | 5.98 | 1.6212871 | 909 |
| Academic institutions | 899.75 | 3.65 | 2.6938623 | 334 |
| Other public or mixed entities, created by law whose purpose is to act in the public interest | 785.25 | 3.19 | 2.8145161 | 279 |
| Other organisations | 514.75 | 2.09 | 1.6393312 | 314 |
| Regional structures | 454.25 | 1.84 | 4.0923423 | 111 |
| Other sub-national public authorities | 364.50 | 1.48 | 3.6089109 | 101 |
| Self-employed consultants | 254.25 | 1.03 | 0.7995283 | 318 |
| Transnational associations and networks of public regional or other sub-national authorities | 214.75 | 0.87 | 2.4970930 | 86 |
`summarise()` has grouped output by 'In_EG'. You can override using the
`.groups` argument.| Nombre d'ETP dans les organisations | ||||||||
| En fonction du type d'organisations | ||||||||
| In_EG | n | min | q1 | med | q3 | max | Mean.FTE | sd.FTE |
|---|---|---|---|---|---|---|---|---|
| Academic institutions | ||||||||
| 0 | 268 | 0.25 | 0.50 | 1.00 | 3.00 | 86.00 | 2.6725746 | 6.1334125 |
| 1 | 66 | 0.25 | 0.50 | 1.50 | 3.44 | 23.00 | 2.7803030 | 3.8750968 |
| Companies & groups | ||||||||
| 0 | 2008 | 0.25 | 0.25 | 0.75 | 1.50 | 45.00 | 1.4717380 | 2.7209725 |
| 1 | 332 | 0.25 | 0.50 | 1.50 | 3.00 | 15.25 | 2.2266566 | 2.4057814 |
| Non-governmental organisations, platforms and networks and similar | ||||||||
| 0 | 2596 | 0.25 | 0.50 | 1.00 | 2.50 | 54.00 | 2.2078197 | 3.4874331 |
| 1 | 575 | 0.25 | 0.50 | 1.50 | 3.50 | 29.00 | 2.9756522 | 4.1862994 |
| Other organisations | ||||||||
| 0 | 276 | 0.25 | 0.50 | 0.75 | 2.00 | 15.25 | 1.5643116 | 2.0998233 |
| 1 | 38 | 0.25 | 0.50 | 1.12 | 2.62 | 12.50 | 2.1842105 | 2.6652698 |
| Other public or mixed entities, created by law whose purpose is to act in the public interest | ||||||||
| 0 | 228 | 0.25 | 0.50 | 1.00 | 3.00 | 38.00 | 2.7894737 | 4.7757047 |
| 1 | 51 | 0.25 | 0.25 | 1.00 | 2.75 | 39.00 | 2.9264706 | 5.9553115 |
| Other sub-national public authorities | ||||||||
| 0 | 92 | 0.25 | 0.50 | 1.75 | 4.81 | 43.75 | 3.4402174 | 5.5110241 |
| 1 | 9 | 0.25 | 1.25 | 6.25 | 9.50 | 11.25 | 5.3333333 | 4.6046851 |
| Professional consultancies | ||||||||
| 0 | 632 | 0.25 | 0.50 | 1.00 | 2.75 | 41.25 | 2.8560127 | 5.0405679 |
| 1 | 31 | 0.25 | 0.25 | 0.50 | 2.62 | 20.00 | 2.4516129 | 4.3990621 |
| Regional structures | ||||||||
| 0 | 100 | 0.25 | 1.00 | 2.62 | 5.00 | 23.00 | 3.9500000 | 4.6766668 |
| 1 | 11 | 0.25 | 1.00 | 2.00 | 7.25 | 21.25 | 5.3863636 | 6.6552269 |
| Self-employed consultants | ||||||||
| 0 | 303 | 0.25 | 0.25 | 0.75 | 1.00 | 9.75 | 0.8110561 | 0.8790619 |
| 1 | 15 | 0.25 | 0.25 | 0.25 | 1.00 | 1.50 | 0.5666667 | 0.4169047 |
| Think tanks and research institutions | ||||||||
| 0 | 505 | 0.25 | 0.50 | 1.50 | 4.00 | 91.50 | 3.5900990 | 6.4134617 |
| 1 | 82 | 0.25 | 0.50 | 1.50 | 4.88 | 30.00 | 3.7591463 | 5.8721519 |
| Trade and business associations | ||||||||
| 0 | 1818 | 0.25 | 0.50 | 1.00 | 1.75 | 37.50 | 1.4661716 | 1.9892625 |
| 1 | 632 | 0.25 | 0.75 | 1.75 | 3.50 | 49.00 | 2.9794304 | 4.2585065 |
| Trade unions and professional associations | ||||||||
| 0 | 740 | 0.25 | 0.25 | 0.75 | 1.50 | 19.75 | 1.3283784 | 1.8308749 |
| 1 | 169 | 0.25 | 0.75 | 1.75 | 4.00 | 22.25 | 2.9038462 | 3.3445496 |
| Transnational associations and networks of public regional or other sub-national authorities | ||||||||
| 0 | 63 | 0.25 | 0.50 | 1.50 | 3.50 | 11.25 | 2.5595238 | 2.8325991 |
| 1 | 23 | 0.25 | 0.88 | 2.00 | 3.00 | 7.50 | 2.3260870 | 2.0621519 |
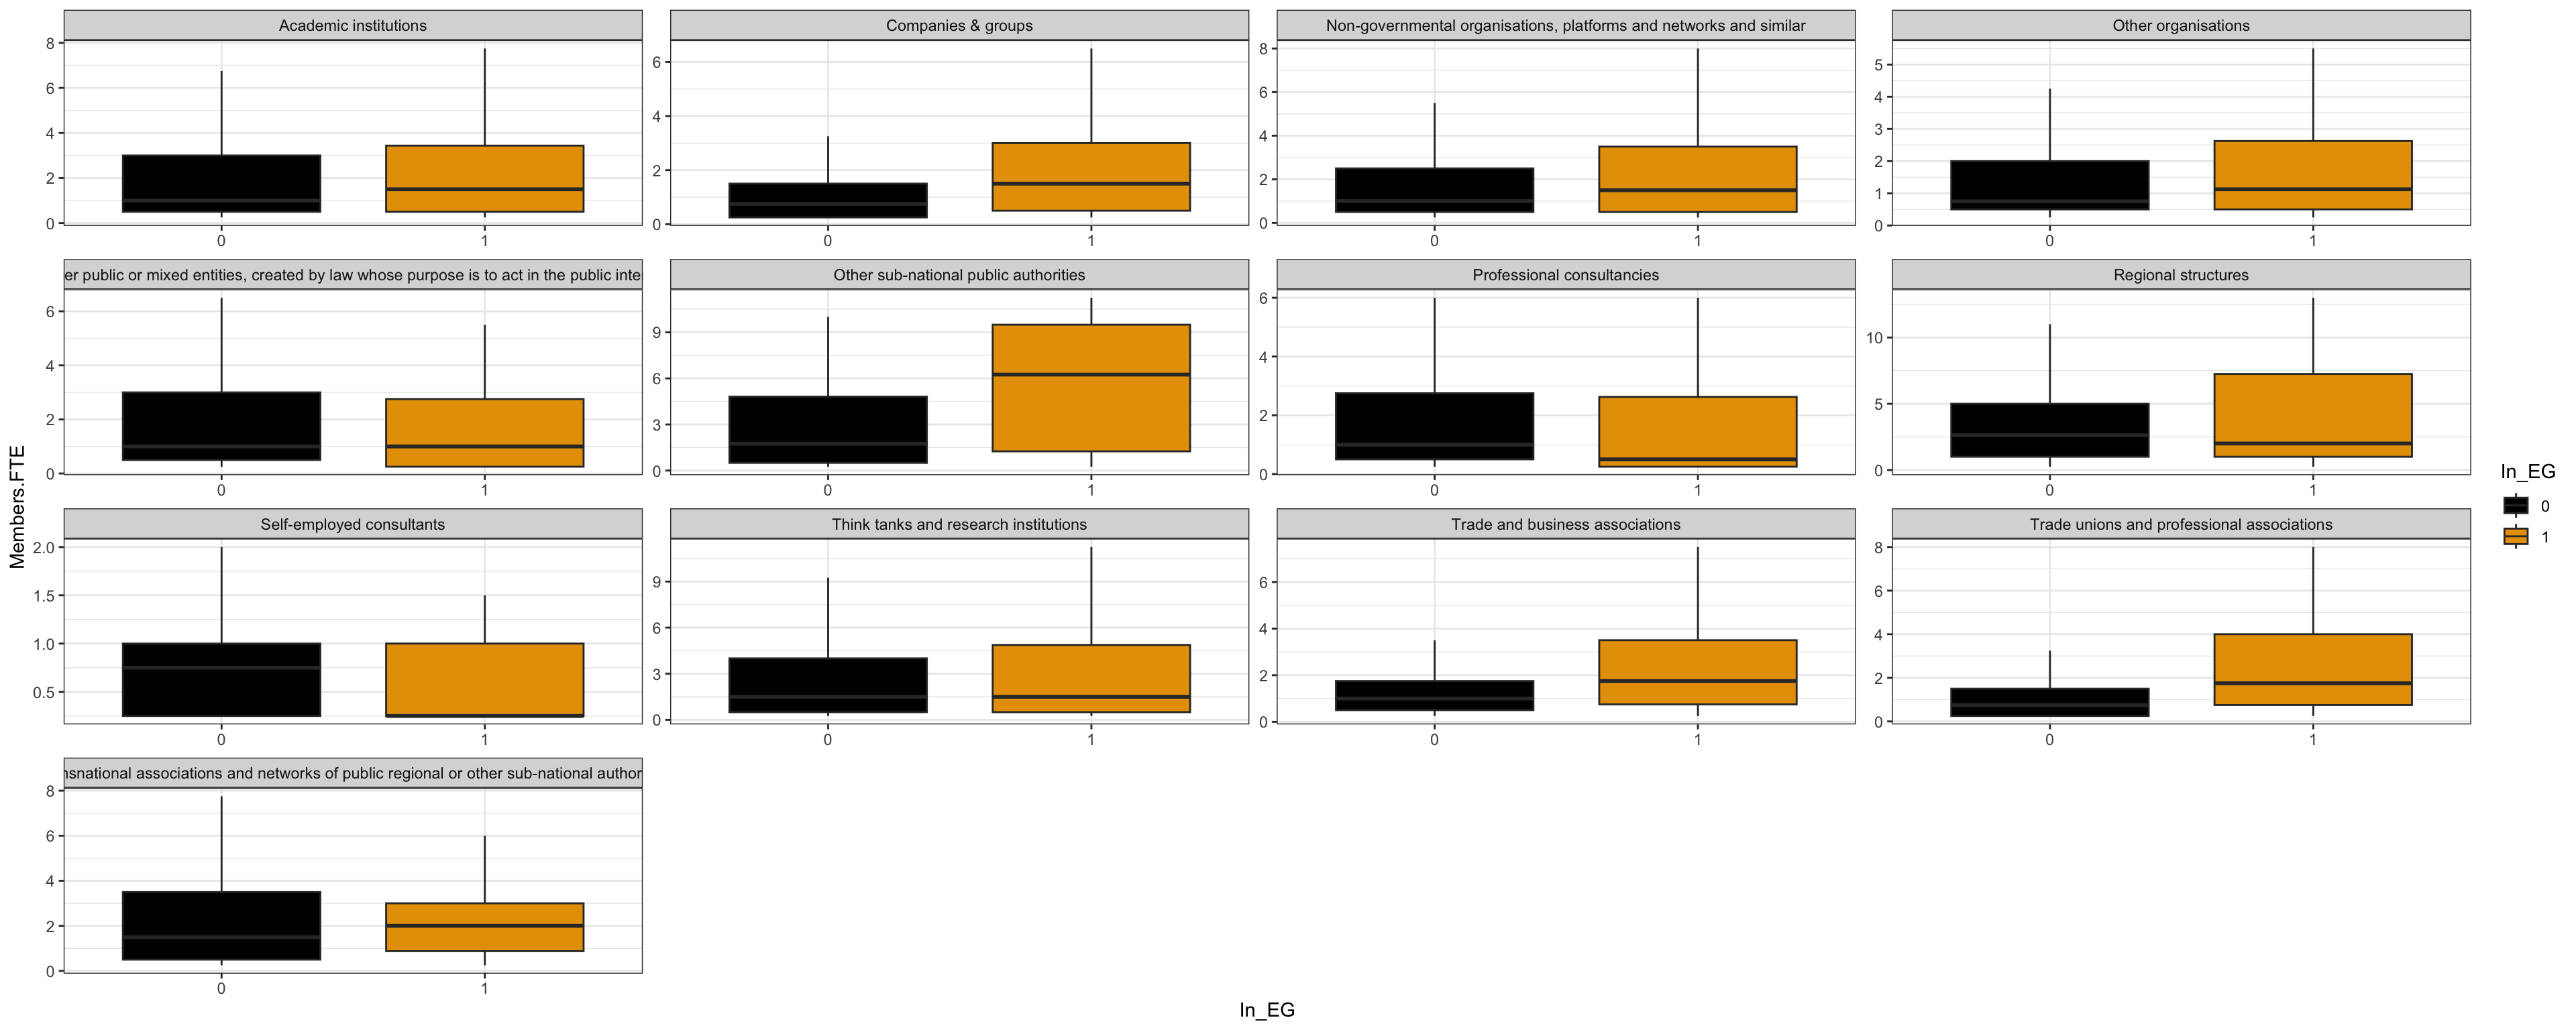
| Characteristic |
In_EG
|
No_EG
|
||
|---|---|---|---|---|
| N = 2,0341 | p-value2 | N = 9,6291 | p-value2 | |
| Subsection | <0.001 | <0.001 | ||
| Academic institutions | 1.50 (0.50, 3.50) | 1.00 (0.50, 3.00) | ||
| Companies & groups | 1.50 (0.50, 3.00) | 0.75 (0.25, 1.50) | ||
| Non-governmental organisations, platforms and networks and similar | 1.50 (0.50, 3.50) | 1.00 (0.50, 2.50) | ||
| Other organisations | 1.13 (0.50, 2.75) | 0.75 (0.50, 2.00) | ||
| Other public or mixed entities, created by law whose purpose is to act in the public interest | 1.00 (0.25, 3.00) | 1.00 (0.50, 3.00) | ||
| Other sub-national public authorities | 6.25 (1.25, 9.50) | 1.75 (0.50, 4.88) | ||
| Professional consultancies | 0.50 (0.25, 2.75) | 1.00 (0.50, 2.75) | ||
| Regional structures | 2.00 (0.75, 9.50) | 2.63 (1.00, 5.00) | ||
| Self-employed consultants | 0.25 (0.25, 1.00) | 0.75 (0.25, 1.00) | ||
| Think tanks and research institutions | 1.50 (0.50, 5.00) | 1.50 (0.50, 4.00) | ||
| Trade and business associations | 1.75 (0.75, 3.50) | 1.00 (0.50, 1.75) | ||
| Trade unions and professional associations | 1.75 (0.75, 4.00) | 0.75 (0.25, 1.50) | ||
| Transnational associations and networks of public regional or other sub-national authorities | 2.00 (0.75, 3.25) | 1.50 (0.50, 3.50) | ||
| 1 Members.FTE: Median (Q1, Q3) | ||||
| 2 Kruskal-Wallis rank sum test | ||||
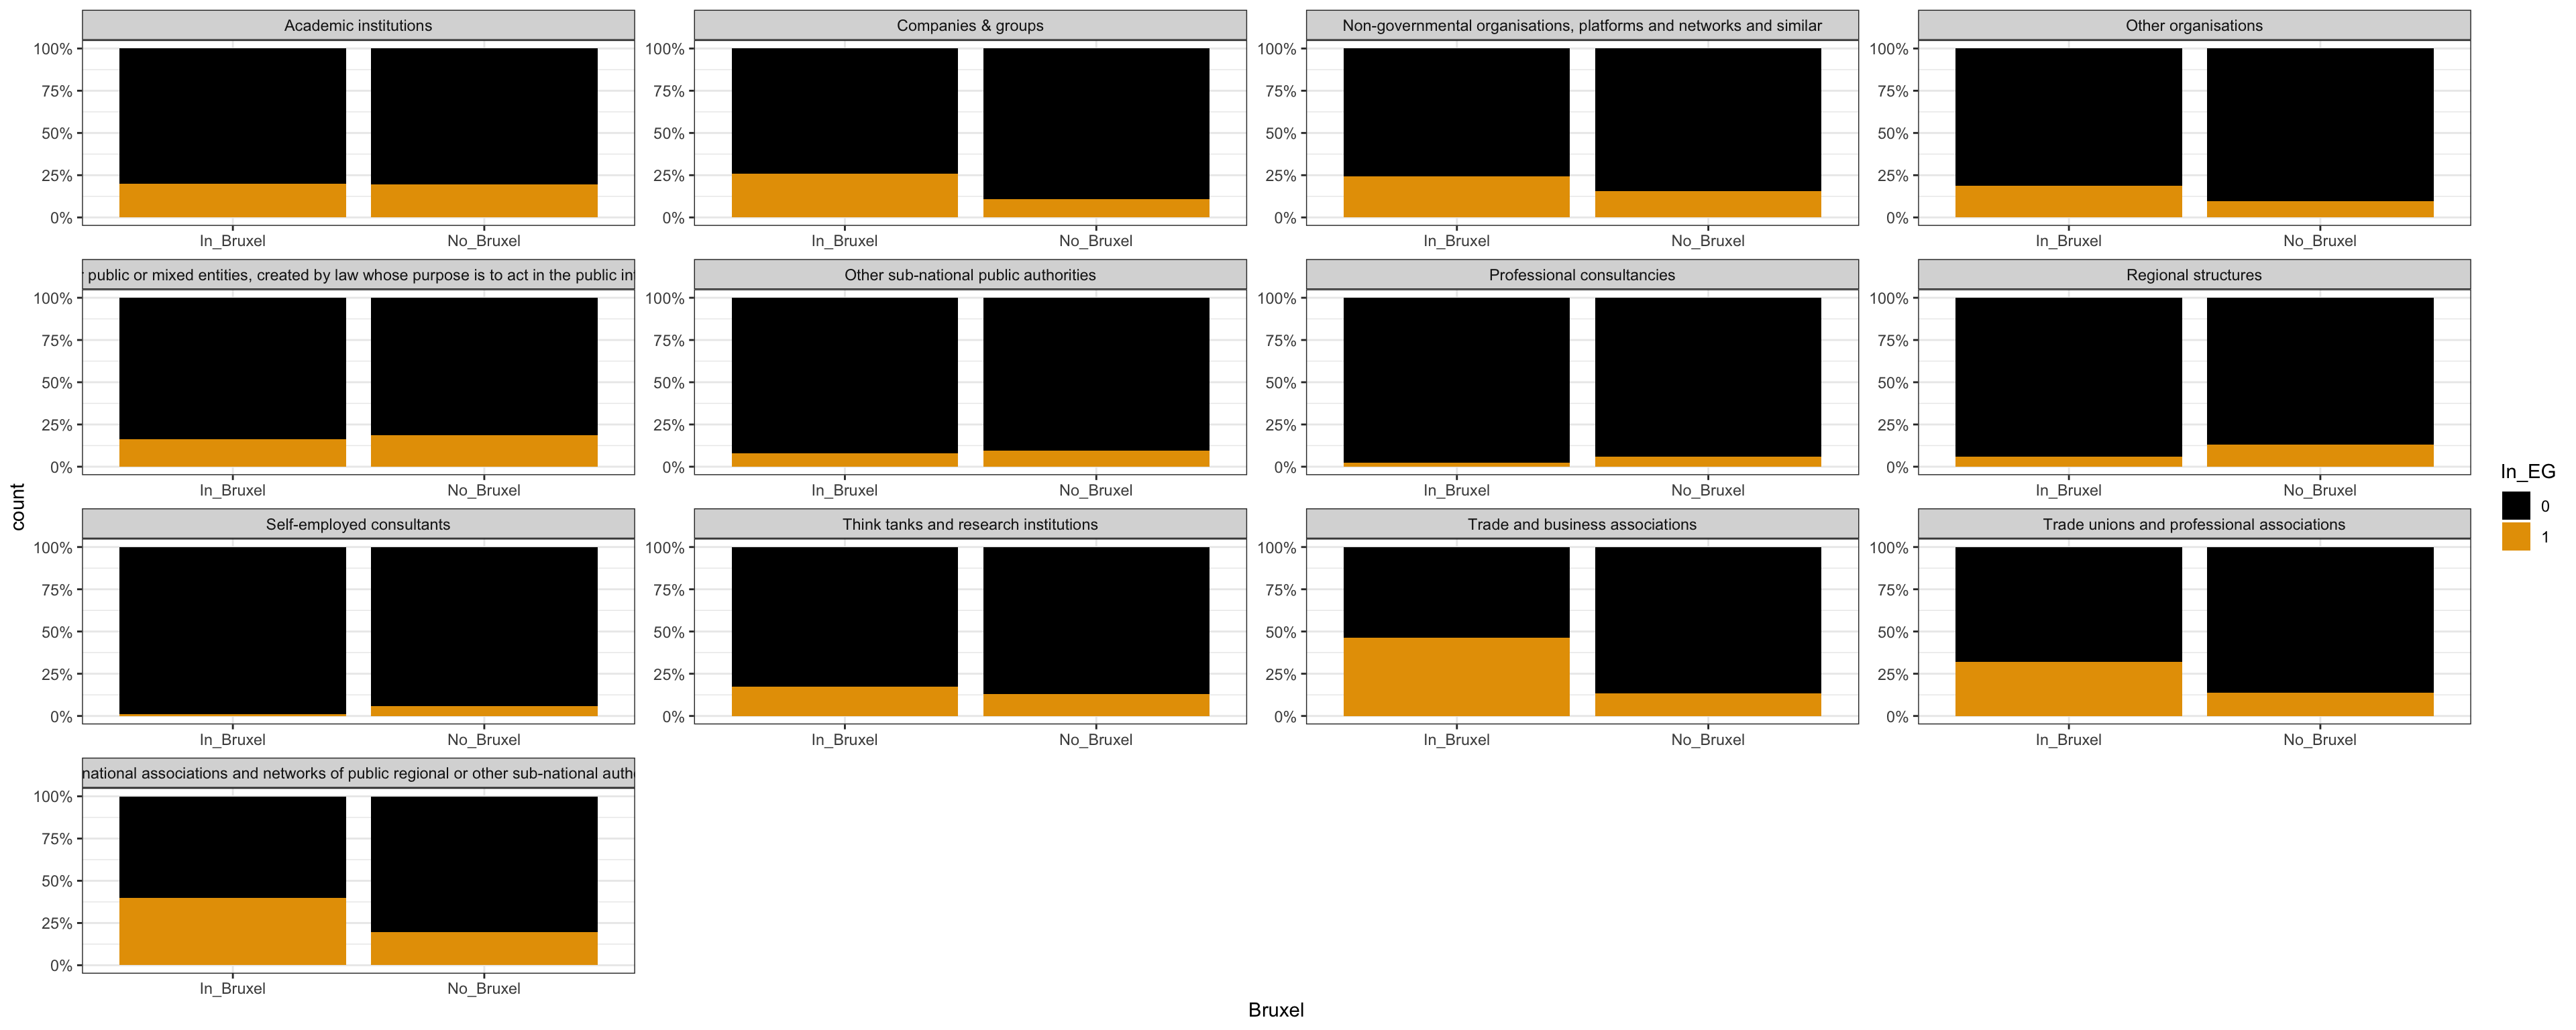
| Characteristic | In_Bruxel N = 3,3221 |
No_Bruxel N = 8,3411 |
p-value2 |
|---|---|---|---|
| Subsection | <0.001 | ||
| Academic institutions | 40 (1.2%) | 294 (3.5%) | |
| Companies & groups | 506 (15%) | 1,834 (22%) | |
| Non-governmental organisations, platforms and networks and similar | 886 (27%) | 2,285 (27%) | |
| Other organisations | 86 (2.6%) | 228 (2.7%) | |
| Other public or mixed entities, created by law whose purpose is to act in the public interest | 55 (1.7%) | 224 (2.7%) | |
| Other sub-national public authorities | 38 (1.1%) | 63 (0.8%) | |
| Professional consultancies | 245 (7.4%) | 418 (5.0%) | |
| Regional structures | 50 (1.5%) | 61 (0.7%) | |
| Self-employed consultants | 85 (2.6%) | 233 (2.8%) | |
| Think tanks and research institutions | 143 (4.3%) | 444 (5.3%) | |
| Trade and business associations | 922 (28%) | 1,528 (18%) | |
| Trade unions and professional associations | 236 (7.1%) | 673 (8.1%) | |
| Transnational associations and networks of public regional or other sub-national authorities | 30 (0.9%) | 56 (0.7%) | |
| 1 n (%) | |||
| 2 Pearson’s Chi-squared test | |||
The following errors were returned during `tbl_strata()`:
✖ For variable `Subsection` (`Bruxel`) and "estimate", "p.value", "conf.low",
  and "conf.high" statistics: FEXACT erreur 7(location). LDSTP=18270 est trop
  petit pour ce problème, (pastp=11.825, ipn_0:=ipoin[itp=567]=1429,
  stp[ipn_0]=5.53339). Augmentez la taille de l’environnement de travail ou
considérez l’utilisation de ‘simulate.p.value=TRUE’.| Characteristic |
In_EG
|
No_EG
|
||||
|---|---|---|---|---|---|---|
| In_Bruxel N = 9321 |
No_Bruxel N = 1,1021 |
p-value | In_Bruxel N = 2,3901 |
No_Bruxel N = 7,2391 |
p-value2 | |
| Subsection | <0.001 | |||||
| Academic institutions | 8 (0.9%) | 58 (5.3%) | 32 (1.3%) | 236 (3.3%) | ||
| Companies & groups | 131 (14%) | 201 (18%) | 375 (16%) | 1,633 (23%) | ||
| Non-governmental organisations, platforms and networks and similar | 215 (23%) | 360 (33%) | 671 (28%) | 1,925 (27%) | ||
| Other organisations | 16 (1.7%) | 22 (2.0%) | 70 (2.9%) | 206 (2.8%) | ||
| Other public or mixed entities, created by law whose purpose is to act in the public interest | 9 (1.0%) | 42 (3.8%) | 46 (1.9%) | 182 (2.5%) | ||
| Other sub-national public authorities | 3 (0.3%) | 6 (0.5%) | 35 (1.5%) | 57 (0.8%) | ||
| Professional consultancies | 6 (0.6%) | 25 (2.3%) | 239 (10%) | 393 (5.4%) | ||
| Regional structures | 3 (0.3%) | 8 (0.7%) | 47 (2.0%) | 53 (0.7%) | ||
| Self-employed consultants | 1 (0.1%) | 14 (1.3%) | 84 (3.5%) | 219 (3.0%) | ||
| Think tanks and research institutions | 25 (2.7%) | 57 (5.2%) | 118 (4.9%) | 387 (5.3%) | ||
| Trade and business associations | 427 (46%) | 205 (19%) | 495 (21%) | 1,323 (18%) | ||
| Trade unions and professional associations | 76 (8.2%) | 93 (8.4%) | 160 (6.7%) | 580 (8.0%) | ||
| Transnational associations and networks of public regional or other sub-national authorities | 12 (1.3%) | 11 (1.0%) | 18 (0.8%) | 45 (0.6%) | ||
| 1 n (%) | ||||||
| 2 Pearson’s Chi-squared test | ||||||
Warning: Removed 761 rows containing non-finite outside the scale range
(`stat_boxplot()`).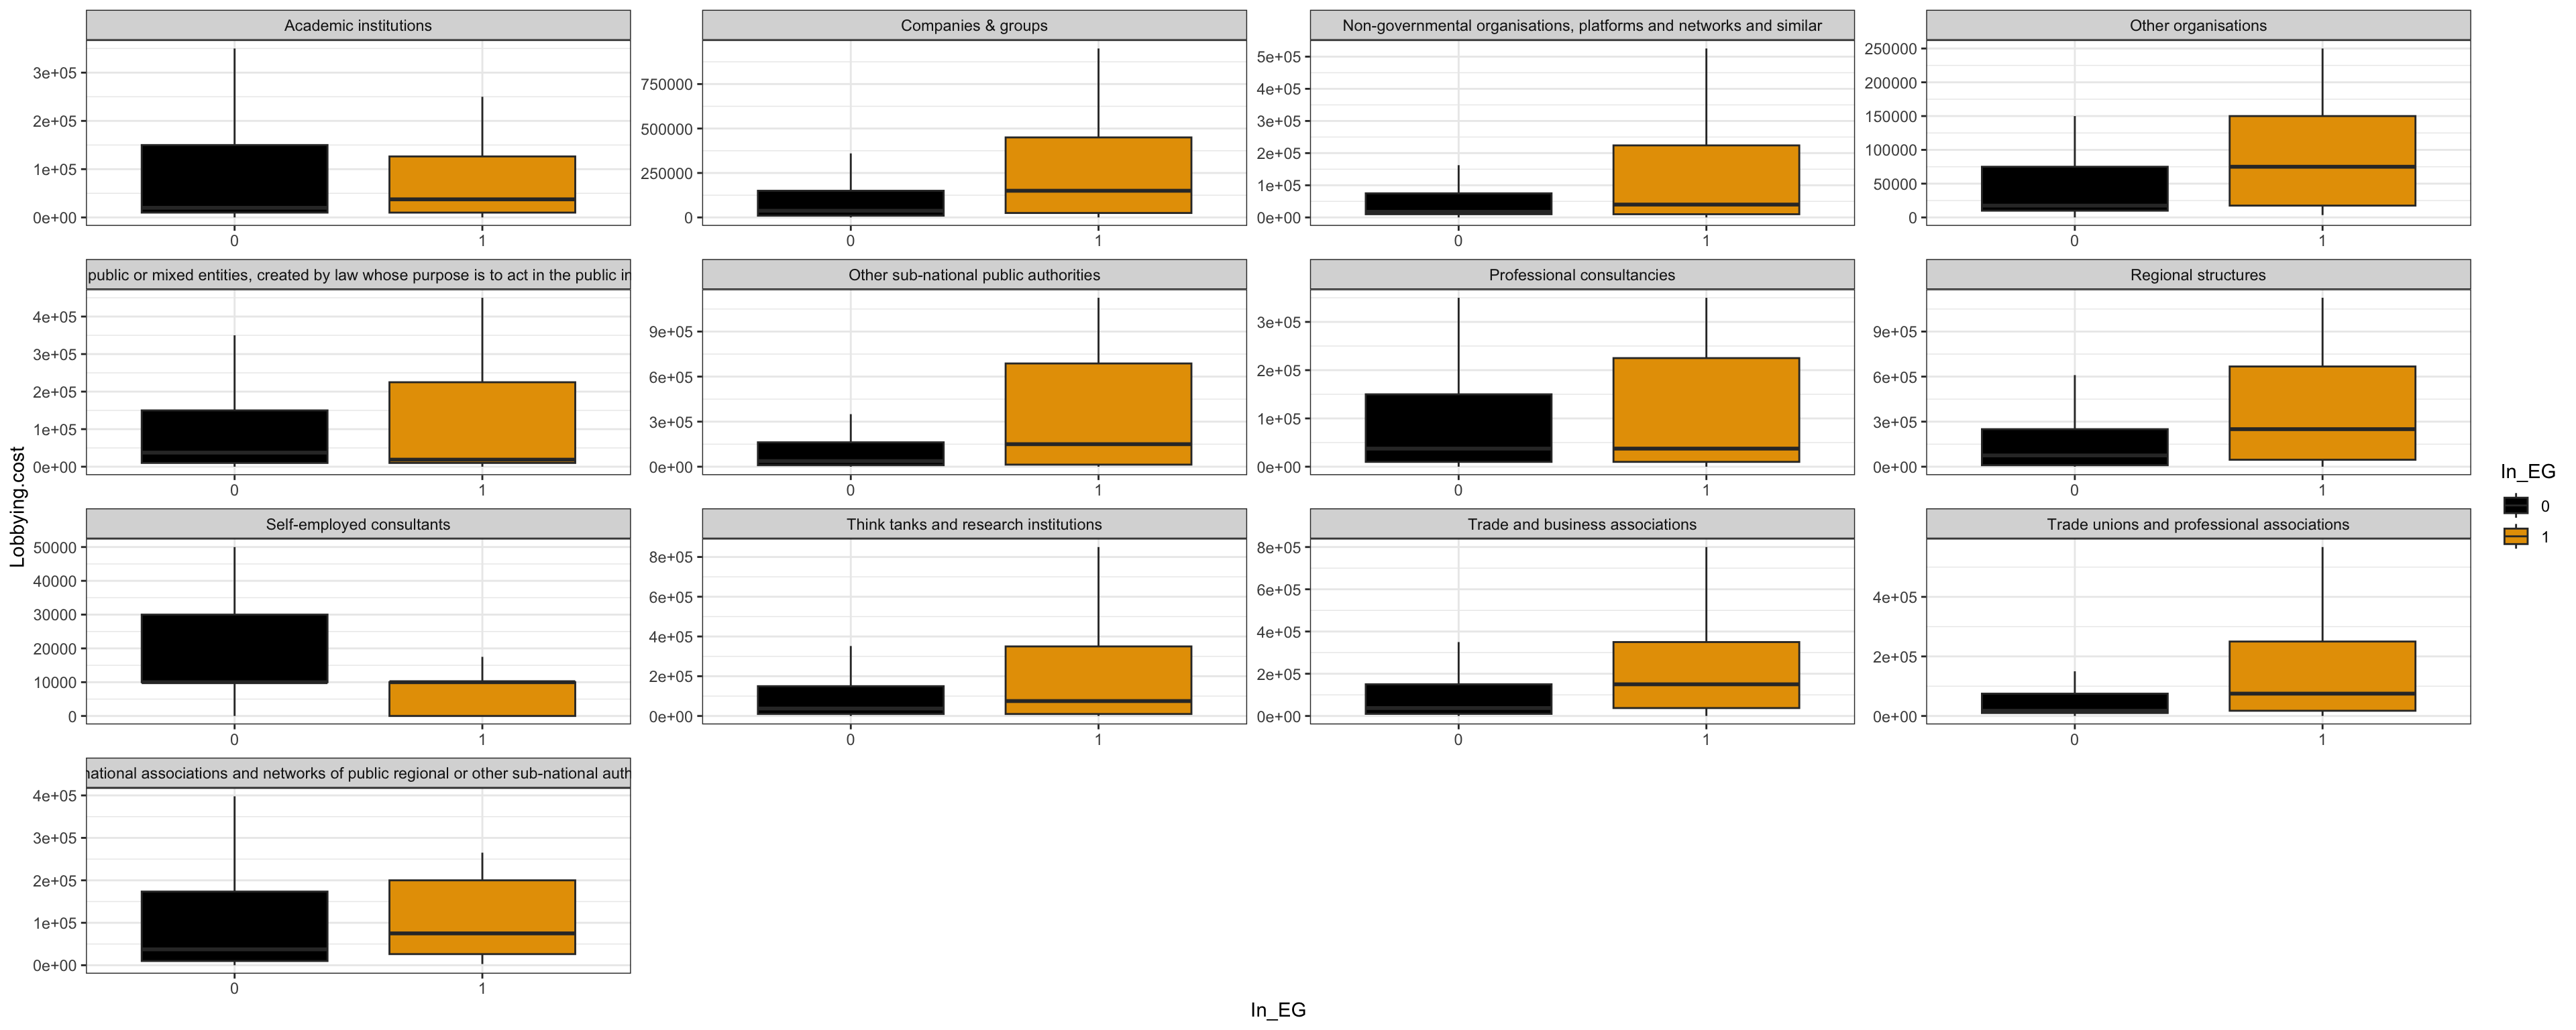
| Characteristic |
In_EG
|
No_EG
|
||
|---|---|---|---|---|
| N = 2,0341 | p-value2 | N = 9,6291 | p-value2 | |
| Subsection | <0.001 | <0.001 | ||
| Academic institutions | 37,500 (9,999, 127,777) | 20,000 (9,999, 150,000) | ||
| Companies & groups | 150,000 (25,000, 450,000) | 37,500 (9,999, 150,000) | ||
| Non-governmental organisations, platforms and networks and similar | 40,000 (9,999, 225,000) | 17,500 (9,999, 75,000) | ||
| Other organisations | 75,000 (17,500, 150,000) | 17,500 (9,999, 75,000) | ||
| Other public or mixed entities, created by law whose purpose is to act in the public interest | 18,750 (9,999, 250,000) | 37,500 (9,999, 150,000) | ||
| Other sub-national public authorities | 150,000 (9,999, 1,125,000) | 37,500 (9,999, 175,000) | ||
| Professional consultancies | 37,500 (9,999, 250,000) | 37,500 (9,999, 150,000) | ||
| Regional structures | 250,000 (17,500, 784,968) | 75,000 (9,999, 250,000) | ||
| Self-employed consultants | 9,999 (0, 9,999) | 9,999 (9,999, 30,000) | ||
| Think tanks and research institutions | 75,000 (9,999, 350,000) | 37,500 (9,999, 150,000) | ||
| Trade and business associations | 150,000 (37,500, 350,000) | 37,500 (9,999, 150,000) | ||
| Trade unions and professional associations | 75,000 (17,500, 250,000) | 17,500 (9,999, 75,000) | ||
| Transnational associations and networks of public regional or other sub-national authorities | 75,000 (17,500, 250,000) | 37,500 (9,999, 180,000) | ||
| 1 Lobbying.cost: Median (Q1, Q3) | ||||
| 2 Kruskal-Wallis rank sum test | ||||
`summarise()` has grouped output by 'In_EG'. You can override using the
`.groups` argument.| Nombre d'ETP dans les organisations | ||||||||
| En fonction du type d'organisations | ||||||||
| In_EG | n | min | q1 | med | q3 | max | Mean.FTE | sd.FTE |
|---|---|---|---|---|---|---|---|---|
| Academic institutions | ||||||||
| 0 | 268 | NA | 9999.0 | 20000 | 150000.0 | NA | NA | NA |
| 1 | 66 | NA | 9999.0 | 37500 | 126388.2 | NA | NA | NA |
| Companies & groups | ||||||||
| 0 | 2008 | NA | 9999.0 | 37500 | 150000.0 | NA | NA | NA |
| 1 | 332 | NA | 25000.0 | 150000 | 450000.0 | NA | NA | NA |
| Non-governmental organisations, platforms and networks and similar | ||||||||
| 0 | 2596 | NA | 9999.0 | 17500 | 75000.0 | NA | NA | NA |
| 1 | 575 | NA | 9999.0 | 40000 | 223991.0 | NA | NA | NA |
| Other organisations | ||||||||
| 0 | 276 | NA | 9999.0 | 17500 | 75000.0 | NA | NA | NA |
| 1 | 38 | 3500 | 17500.0 | 75000 | 150000.0 | 1375000 | 187504.5 | 305264.8 |
| Other public or mixed entities, created by law whose purpose is to act in the public interest | ||||||||
| 0 | 228 | NA | 9999.0 | 37500 | 150000.0 | NA | NA | NA |
| 1 | 51 | NA | 9999.0 | 18750 | 225000.0 | NA | NA | NA |
| Other sub-national public authorities | ||||||||
| 0 | 92 | NA | 9999.0 | 37500 | 162500.0 | NA | NA | NA |
| 1 | 9 | NA | 13749.5 | 150000 | 687500.0 | NA | NA | NA |
| Professional consultancies | ||||||||
| 0 | 632 | NA | 9999.0 | 37500 | 150000.0 | NA | NA | NA |
| 1 | 31 | NA | 9999.0 | 37500 | 225000.0 | NA | NA | NA |
| Regional structures | ||||||||
| 0 | 100 | NA | 9999.0 | 75000 | 250000.0 | NA | NA | NA |
| 1 | 11 | 0 | 46250.0 | 250000 | 667484.0 | 2125000 | 482951.5 | 655623.1 |
| Self-employed consultants | ||||||||
| 0 | 303 | NA | 9999.0 | 9999 | 30000.0 | NA | NA | NA |
| 1 | 15 | NA | 0.0 | 9999 | 9999.0 | NA | NA | NA |
| Think tanks and research institutions | ||||||||
| 0 | 505 | NA | 9999.0 | 37500 | 150000.0 | NA | NA | NA |
| 1 | 82 | NA | 9999.0 | 75000 | 350000.0 | NA | NA | NA |
| Trade and business associations | ||||||||
| 0 | 1818 | NA | 9999.0 | 37500 | 150000.0 | NA | NA | NA |
| 1 | 632 | NA | 37500.0 | 150000 | 350000.0 | NA | NA | NA |
| Trade unions and professional associations | ||||||||
| 0 | 740 | NA | 9999.0 | 17500 | 75000.0 | NA | NA | NA |
| 1 | 169 | NA | 17500.0 | 75000 | 250000.0 | NA | NA | NA |
| Transnational associations and networks of public regional or other sub-national authorities | ||||||||
| 0 | 63 | NA | 9999.0 | 37500 | 173532.0 | NA | NA | NA |
| 1 | 23 | 2850 | 26250.0 | 75000 | 200000.0 | 950000 | 187738.3 | 266955.0 |
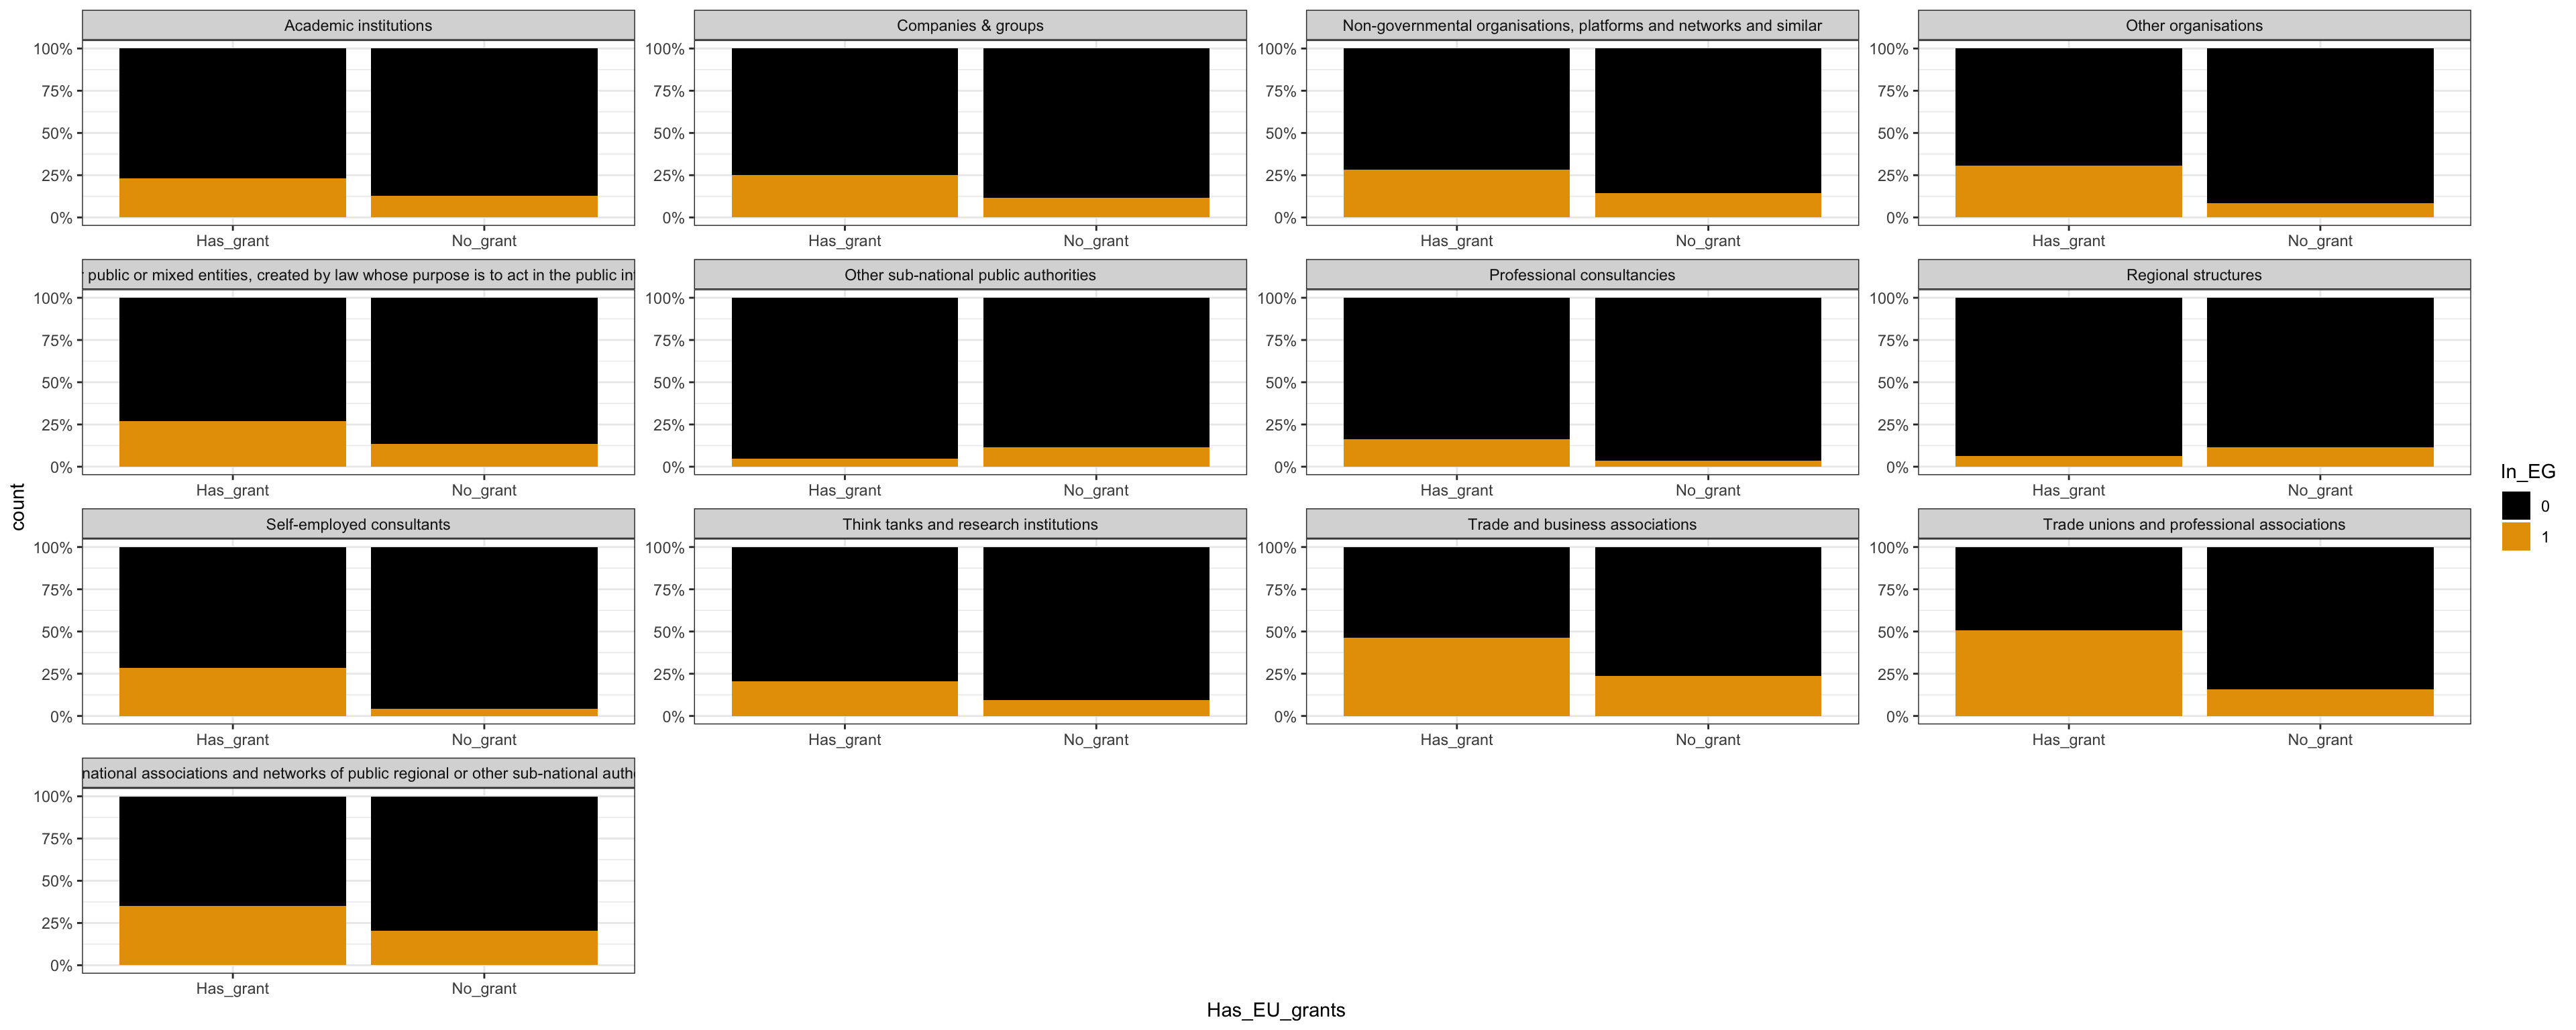
| Characteristic | Has_grant N = 2,3921 |
No_grant N = 9,2711 |
p-value2 |
|---|---|---|---|
| Subsection | <0.001 | ||
| Academic institutions | 223 (9.3%) | 111 (1.2%) | |
| Companies & groups | 435 (18%) | 1,905 (21%) | |
| Non-governmental organisations, platforms and networks and similar | 875 (37%) | 2,296 (25%) | |
| Other organisations | 52 (2.2%) | 262 (2.8%) | |
| Other public or mixed entities, created by law whose purpose is to act in the public interest | 96 (4.0%) | 183 (2.0%) | |
| Other sub-national public authorities | 41 (1.7%) | 60 (0.6%) | |
| Professional consultancies | 61 (2.6%) | 602 (6.5%) | |
| Regional structures | 32 (1.3%) | 79 (0.9%) | |
| Self-employed consultants | 7 (0.3%) | 311 (3.4%) | |
| Think tanks and research institutions | 237 (9.9%) | 350 (3.8%) | |
| Trade and business associations | 225 (9.4%) | 2,225 (24%) | |
| Trade unions and professional associations | 71 (3.0%) | 838 (9.0%) | |
| Transnational associations and networks of public regional or other sub-national authorities | 37 (1.5%) | 49 (0.5%) | |
| 1 n (%) | |||
| 2 Pearson’s Chi-squared test | |||
The following errors were returned during `tbl_strata()`:
✖ For variable `Subsection` (`Has_EU_grants`) and "estimate", "p.value",
  "conf.low", and "conf.high" statistics: FEXACT erreur 7(location).
  LDSTP=18270 est trop petit pour ce problème, (pastp=28.9269,
  ipn_0:=ipoin[itp=236]=529, stp[ipn_0]=24.366). Augmentez la taille de
  l’environnement de travail ou considérez l’utilisation de
‘simulate.p.value=TRUE’.| Characteristic |
In_EG
|
No_EG
|
||||
|---|---|---|---|---|---|---|
| Has_grant N = 6671 |
No_grant N = 1,3671 |
p-value | Has_grant N = 1,7251 |
No_grant N = 7,9041 |
p-value2 | |
| Subsection | <0.001 | |||||
| Academic institutions | 52 (7.8%) | 14 (1.0%) | 171 (9.9%) | 97 (1.2%) | ||
| Companies & groups | 109 (16%) | 223 (16%) | 326 (19%) | 1,682 (21%) | ||
| Non-governmental organisations, platforms and networks and similar | 246 (37%) | 329 (24%) | 629 (36%) | 1,967 (25%) | ||
| Other organisations | 16 (2.4%) | 22 (1.6%) | 36 (2.1%) | 240 (3.0%) | ||
| Other public or mixed entities, created by law whose purpose is to act in the public interest | 26 (3.9%) | 25 (1.8%) | 70 (4.1%) | 158 (2.0%) | ||
| Other sub-national public authorities | 2 (0.3%) | 7 (0.5%) | 39 (2.3%) | 53 (0.7%) | ||
| Professional consultancies | 10 (1.5%) | 21 (1.5%) | 51 (3.0%) | 581 (7.4%) | ||
| Regional structures | 2 (0.3%) | 9 (0.7%) | 30 (1.7%) | 70 (0.9%) | ||
| Self-employed consultants | 2 (0.3%) | 13 (1.0%) | 5 (0.3%) | 298 (3.8%) | ||
| Think tanks and research institutions | 49 (7.3%) | 33 (2.4%) | 188 (11%) | 317 (4.0%) | ||
| Trade and business associations | 104 (16%) | 528 (39%) | 121 (7.0%) | 1,697 (21%) | ||
| Trade unions and professional associations | 36 (5.4%) | 133 (9.7%) | 35 (2.0%) | 705 (8.9%) | ||
| Transnational associations and networks of public regional or other sub-national authorities | 13 (1.9%) | 10 (0.7%) | 24 (1.4%) | 39 (0.5%) | ||
| 1 n (%) | ||||||
| 2 Pearson’s Chi-squared test | ||||||
| Characteristic | N = 11,6631 |
|---|---|
| Subsection | |
| Academic institutions | 0.0 (0.0 - 0.0) | 1.0 - 12.0 |
| Companies & groups | 0.0 (0.0 - 2.0) | 10.0 - 203.0 |
| Non-governmental organisations, platforms and networks and similar | 0.0 (0.0 - 0.0) | 2.0 - 140.0 |
| Other organisations | 0.0 (0.0 - 0.0) | 3.0 - 34.0 |
| Other public or mixed entities, created by law whose purpose is to act in the public interest | 0.0 (0.0 - 0.0) | 2.0 - 52.0 |
| Other sub-national public authorities | 0.0 (0.0 - 1.0) | 2.0 - 35.0 |
| Professional consultancies | 0.0 (0.0 - 1.0) | 3.0 - 57.0 |
| Regional structures | 0.0 (0.0 - 1.0) | 2.0 - 18.0 |
| Self-employed consultants | 0.0 (0.0 - 0.0) | 1.0 - 8.0 |
| Think tanks and research institutions | 0.0 (0.0 - 1.0) | 3.0 - 53.0 |
| Trade and business associations | 0.0 (0.0 - 1.0) | 7.0 - 194.0 |
| Trade unions and professional associations | 0.0 (0.0 - 0.0) | 2.0 - 88.0 |
| Transnational associations and networks of public regional or other sub-national authorities | 0.0 (0.0 - 0.0) | 2.0 - 10.0 |
| 1 Meetings: Median (Q1 - Q3) | 90% Centile - Max | |
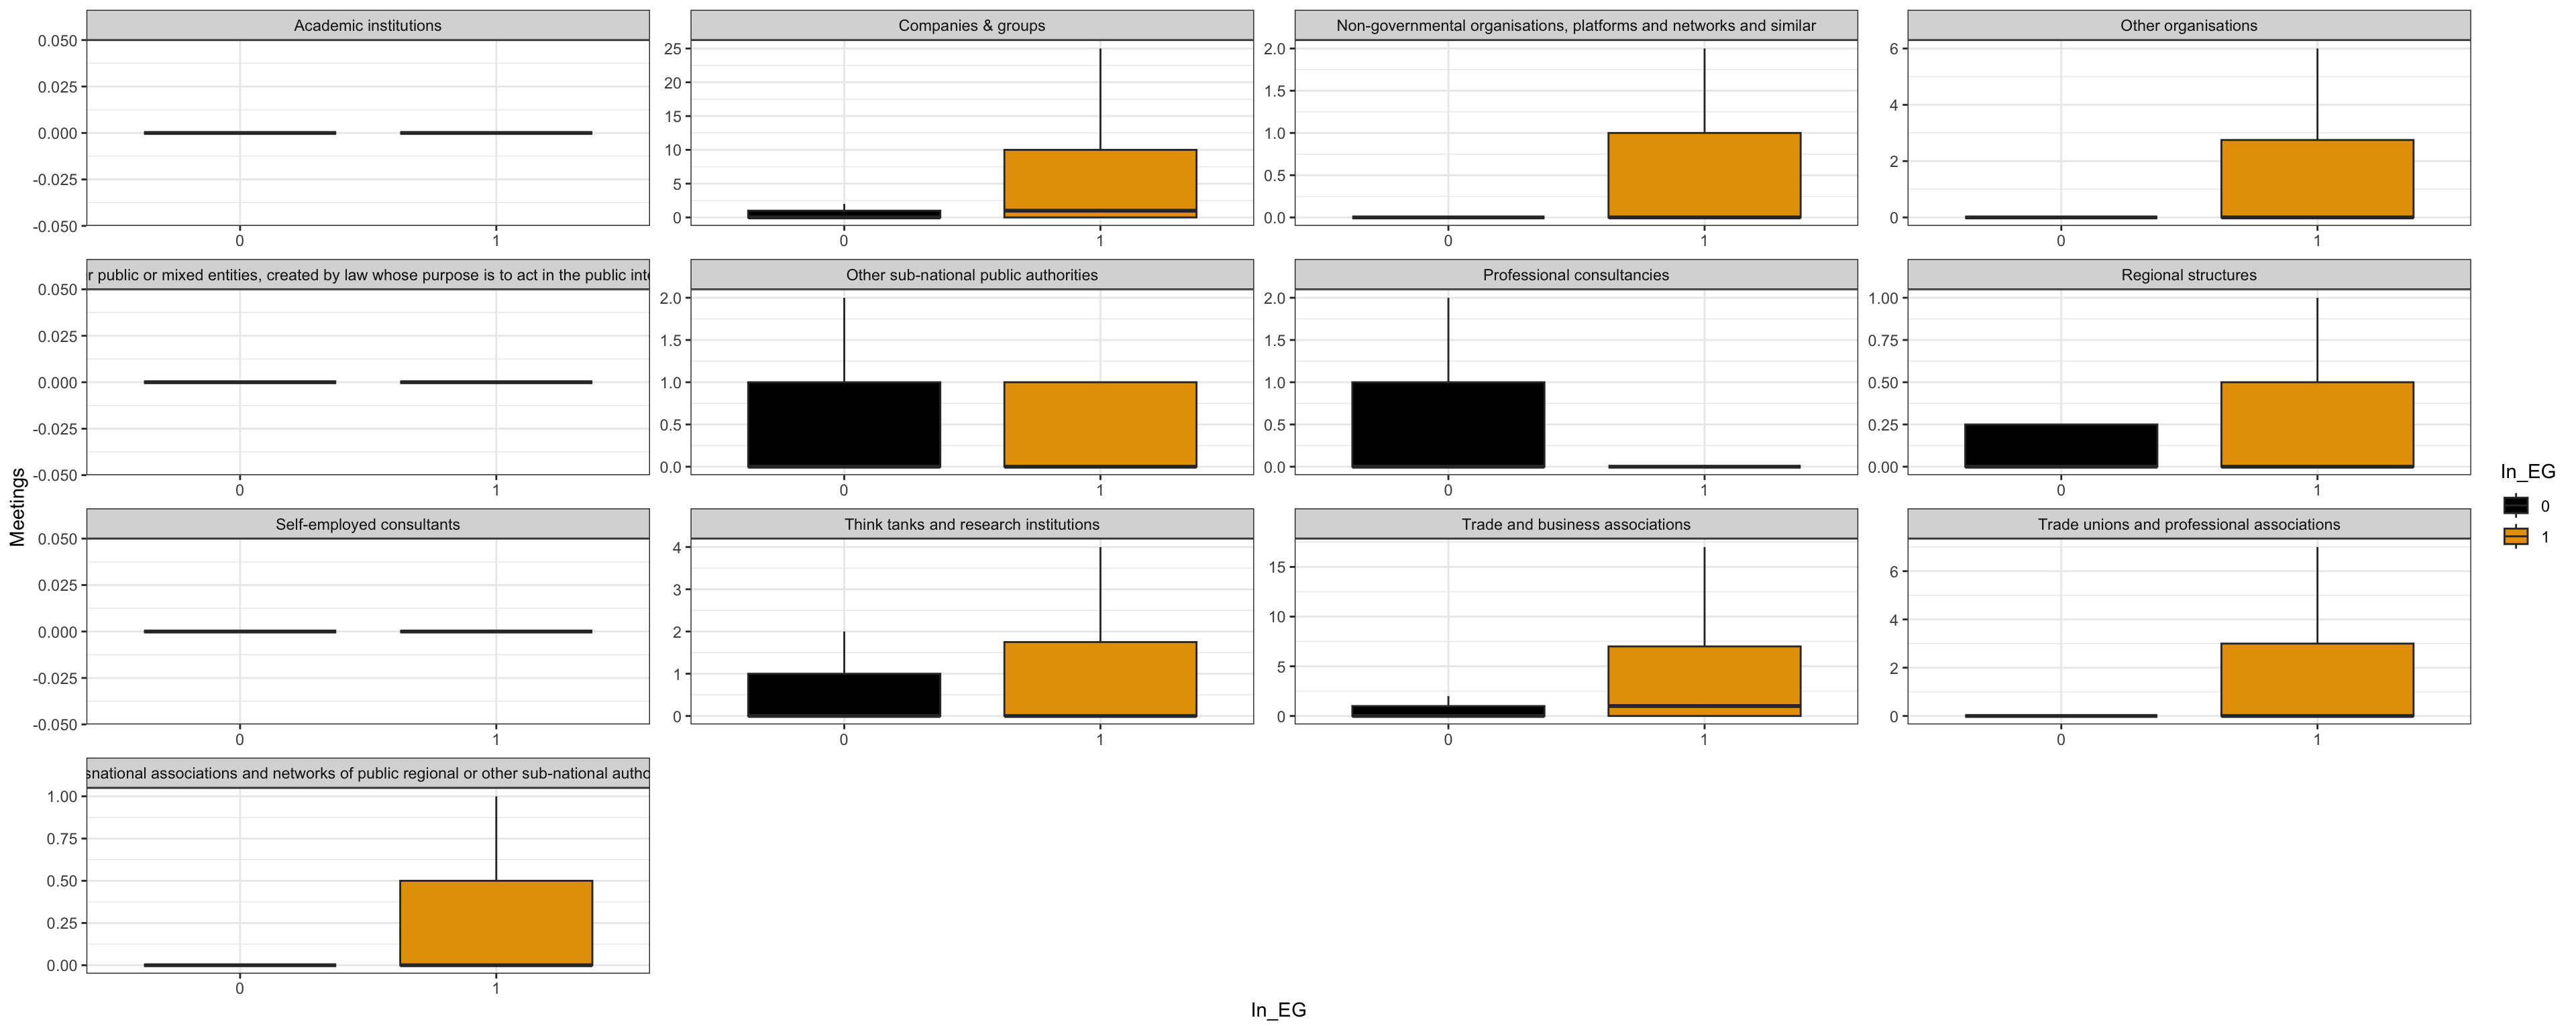
| Characteristic |
In_EG
|
No_EG
|
||
|---|---|---|---|---|
| N = 2,0341 | p-value2 | N = 9,6291 | p-value2 | |
| Subsection | <0.001 | <0.001 | ||
| Academic institutions | 0 (0 - 0) | 1 - 12 | 0.00 (0.00 - 0.00) | 2.00 - 4.00 | ||
| Companies & groups | 1 (0 - 10) | 26 - 203 | 0.00 (0.00 - 1.00) | 6.00 - 106.00 | ||
| Non-governmental organisations, platforms and networks and similar | 0 (0 - 1) | 8 - 140 | 0.00 (0.00 - 0.00) | 2.00 - 76.00 | ||
| Other organisations | 0 (0 - 3) | 5 - 18 | 0.00 (0.00 - 0.00) | 2.00 - 34.00 | ||
| Other public or mixed entities, created by law whose purpose is to act in the public interest | 0 (0 - 0) | 2 - 52 | 0.00 (0.00 - 0.00) | 2.00 - 28.00 | ||
| Other sub-national public authorities | 0 (0 - 1) | 35 - 35 | 0.00 (0.00 - 1.00) | 2.00 - 10.00 | ||
| Professional consultancies | 0 (0 - 0) | 12 - 17 | 0.00 (0.00 - 1.00) | 3.00 - 57.00 | ||
| Regional structures | 0 (0 - 1) | 11 - 18 | 0.00 (0.00 - 0.50) | 2.00 - 8.00 | ||
| Self-employed consultants | 0 (0 - 0) | 0 - 2 | 0.00 (0.00 - 0.00) | 1.00 - 8.00 | ||
| Think tanks and research institutions | 0 (0 - 2) | 6 - 36 | 0.00 (0.00 - 1.00) | 3.00 - 53.00 | ||
| Trade and business associations | 1 (0 - 7) | 21 - 194 | 0.00 (0.00 - 1.00) | 3.00 - 61.00 | ||
| Trade unions and professional associations | 0 (0 - 3) | 8 - 88 | 0.00 (0.00 - 0.00) | 1.00 - 46.00 | ||
| Transnational associations and networks of public regional or other sub-national authorities | 0 (0 - 1) | 5 - 10 | 0.00 (0.00 - 0.00) | 1.00 - 6.00 | ||
| 1 Meetings: Median (Q1 - Q3) | 90% Centile - Max | ||||
| 2 Kruskal-Wallis rank sum test | ||||
| Characteristic | N = 11,6631 |
|---|---|
| Subsection | |
| Academic institutions | 1.00 (1.00 - 3.00) | 4.00 - 6.00 / 24 |
| Companies & groups | 2.00 (1.00 - 3.00) | 5.00 - 21.00 / 499 |
| Non-governmental organisations, platforms and networks and similar | 2.00 (1.00 - 4.00) | 6.00 - 26.00 / 589 |
| Other organisations | 2.00 (1.00 - 2.00) | 4.00 - 13.00 / 45 |
| Other public or mixed entities, created by law whose purpose is to act in the public interest | 2.00 (1.00 - 3.00) | 4.00 - 5.00 / 23 |
| Other sub-national public authorities | 3.00 (1.00 - 4.00) | 6.00 - 6.00 / 7 |
| Professional consultancies | 2.00 (1.00 - 6.00) | 13.00 - 58.00 / 194 |
| Regional structures | 4.00 (1.50 - 5.00) | 12.00 - 12.00 / 8 |
| Self-employed consultants | 1.00 (1.00 - 1.00) | 1.00 - 2.00 / 73 |
| Think tanks and research institutions | 2.00 (1.00 - 4.00) | 6.00 - 9.00 / 89 |
| Trade and business associations | 2.00 (1.00 - 3.00) | 6.00 - 24.00 / 549 |
| Trade unions and professional associations | 2.00 (1.00 - 3.00) | 5.00 - 14.00 / 127 |
| Transnational associations and networks of public regional or other sub-national authorities | 2.00 (1.00 - 2.00) | 4.00 - 4.00 / 17 |
| 1 Number.of.EP.accredited.persons: Median (Q1 - Q3) | 90% Centile - Max / N Non-missing | |
Warning: Removed 9419 rows containing non-finite outside the scale range
(`stat_boxplot()`).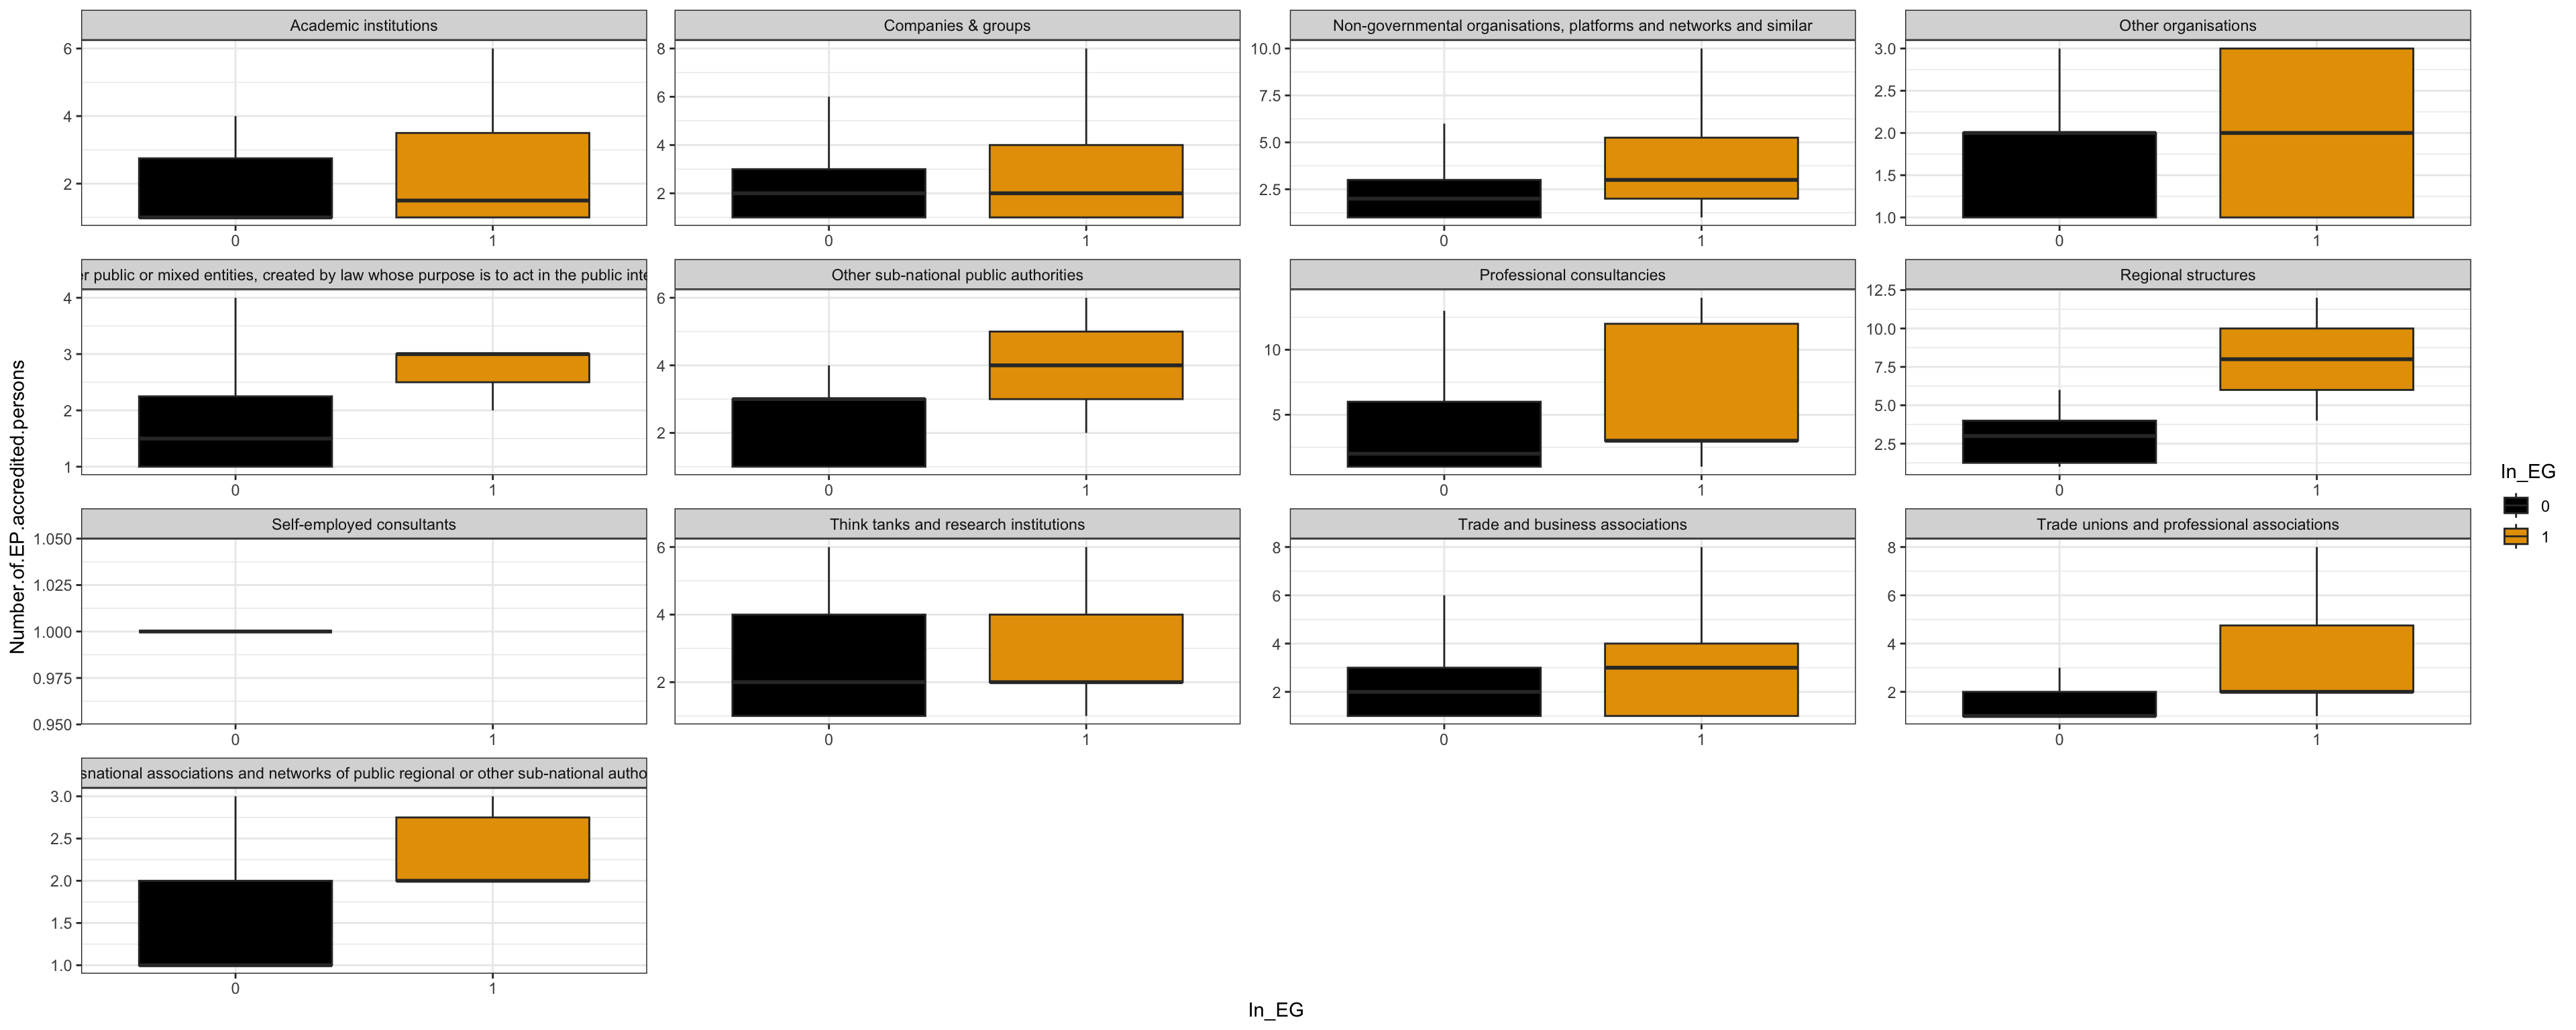
The following warnings were returned during `tbl_strata()`:
! For variable `Number.of.EP.accredited.persons` (`Subsection = "Self-employed
  consultants"`) and "max" statistic: aucun argument pour max ; -Inf est
renvoyé| Characteristic |
In_EG
|
No_EG
|
||
|---|---|---|---|---|
| N = 2,0341 | p-value2 | N = 9,6291 | p-value2 | |
| Subsection | 0.038 | <0.001 | ||
| Academic institutions | 1.50 (1.00 - 4.00) | 6.00 - 6.00 / 6 | 1.00 (1.00 - 3.00) | 4.00 - 6.00 / 18 | ||
| Companies & groups | 2.00 (1.00 - 4.00) | 6.00 - 14.00 / 131 | 2.00 (1.00 - 3.00) | 4.00 - 21.00 / 368 | ||
| Non-governmental organisations, platforms and networks and similar | 3.00 (2.00 - 5.50) | 8.00 - 26.00 / 144 | 2.00 (1.00 - 3.00) | 5.00 - 16.00 / 445 | ||
| Other organisations | 2.00 (1.00 - 3.00) | 11.00 - 11.00 / 9 | 2.00 (1.00 - 2.00) | 3.00 - 13.00 / 36 | ||
| Other public or mixed entities, created by law whose purpose is to act in the public interest | 3.00 (2.00 - 3.00) | 3.00 - 3.00 / 3 | 1.50 (1.00 - 2.50) | 4.50 - 5.00 / 20 | ||
| Other sub-national public authorities | 4.00 (2.00 - 6.00) | 6.00 - 6.00 / 2 | 3.00 (1.00 - 3.00) | 4.00 - 4.00 / 5 | ||
| Professional consultancies | 3.00 (3.00 - 12.00) | 14.00 - 14.00 / 5 | 2.00 (1.00 - 6.00) | 13.00 - 58.00 / 189 | ||
| Regional structures | 8.00 (4.00 - 12.00) | 12.00 - 12.00 / 2 | 3.00 (1.00 - 4.00) | 6.00 - 6.00 / 6 | ||
| Self-employed consultants | NA (NA - NA) | NA - -Inf / 0 | 1.00 (1.00 - 1.00) | 1.00 - 2.00 / 73 | ||
| Think tanks and research institutions | 2.00 (2.00 - 4.00) | 5.00 - 6.00 / 17 | 2.00 (1.00 - 4.00) | 6.00 - 9.00 / 72 | ||
| Trade and business associations | 3.00 (1.00 - 4.00) | 7.00 - 24.00 / 293 | 2.00 (1.00 - 3.00) | 4.00 - 12.00 / 256 | ||
| Trade unions and professional associations | 2.00 (2.00 - 5.00) | 7.00 - 14.00 / 50 | 1.00 (1.00 - 2.00) | 3.00 - 6.00 / 77 | ||
| Transnational associations and networks of public regional or other sub-national authorities | 2.00 (2.00 - 3.00) | 4.00 - 4.00 / 6 | 1.00 (1.00 - 2.00) | 3.00 - 4.00 / 11 | ||
| 1 Number.of.EP.accredited.persons: Median (Q1 - Q3) | 90% Centile - Max / N Non-missing | ||||
| 2 Kruskal-Wallis rank sum test | ||||
The following errors were returned during `tbl_strata()`:
✖ For variable `Subsection` (`In_intergroup`) and "estimate", "p.value",
  "conf.low", and "conf.high" statistics: FEXACT erreur 7(location).
  LDSTP=18270 est trop petit pour ce problème, (pastp=41.7517,
  ipn_0:=ipoin[itp=206]=6946, stp[ipn_0]=42.4585). Augmentez la taille de
  l’environnement de travail ou considérez l’utilisation de
  ‘simulate.p.value=TRUE’.
The following errors were returned during `tbl_strata()`:
✖ For variable `Subsection` (`In_intergroup`) and "estimate", "p.value",
  "conf.low", and "conf.high" statistics: FEXACT erreur 7(location).
  LDSTP=16830 est trop petit pour ce problème, (pastp=97.2627,
  ipn_0:=ipoin[itp=413]=64, stp[ipn_0]=69.8756). Augmentez la taille de
  l’environnement de travail ou considérez l’utilisation de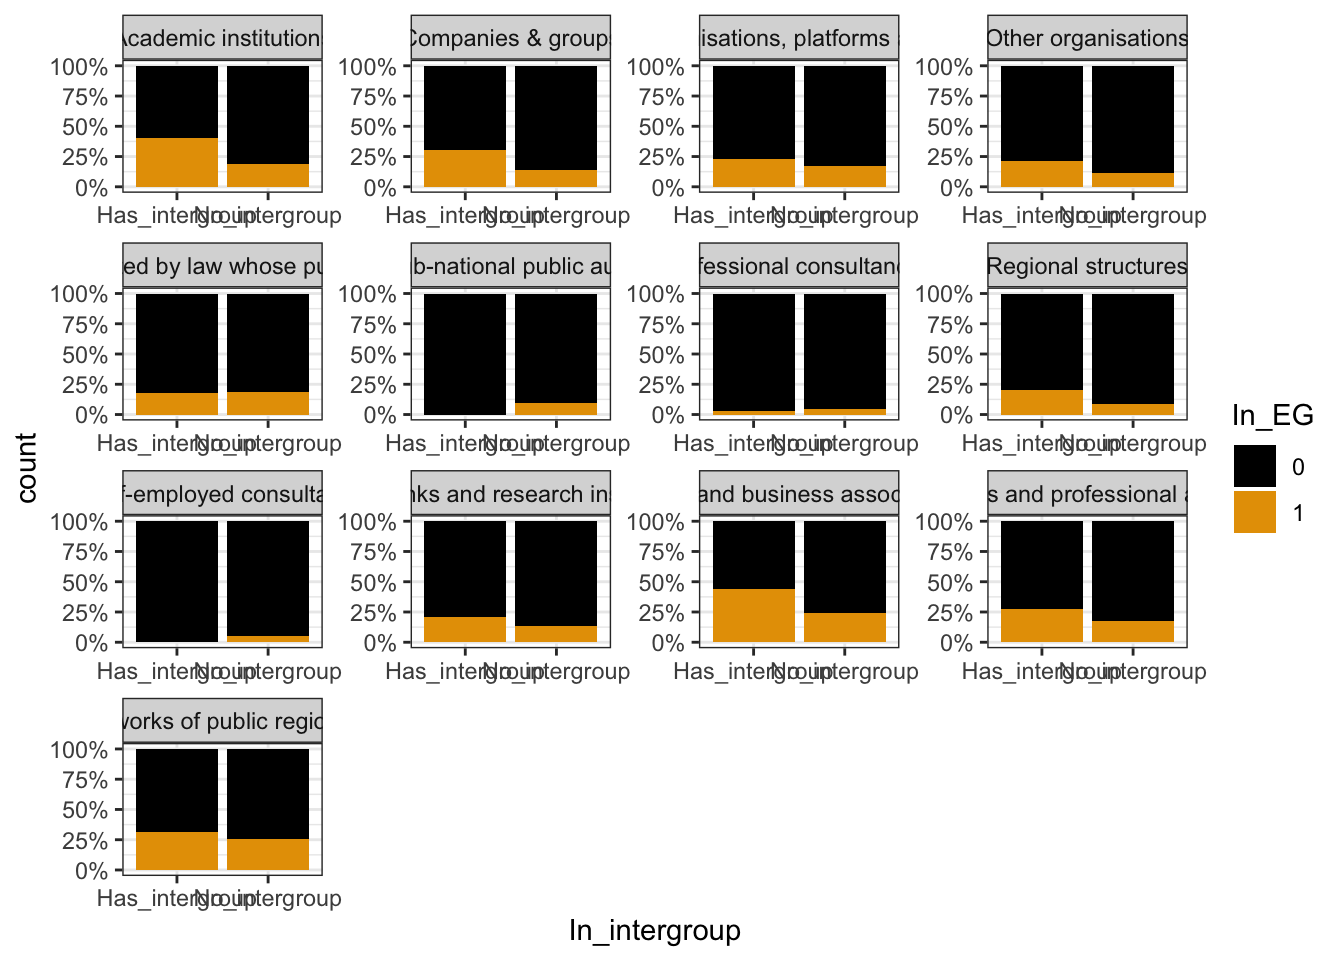
‘simulate.p.value=TRUE’.| Characteristic |
In_EG
|
No_EG
|
||||
|---|---|---|---|---|---|---|
| Has_intergroup N = 2191 |
No_intergroup N = 1,8151 |
p-value | Has_intergroup N = 5731 |
No_intergroup N = 9,0561 |
p-value | |
| Subsection | ||||||
| Academic institutions | 4 (1.8%) | 62 (3.4%) | 6 (1.0%) | 262 (2.9%) | ||
| Companies & groups | 27 (12%) | 305 (17%) | 62 (11%) | 1,946 (21%) | ||
| Non-governmental organisations, platforms and networks and similar | 71 (32%) | 504 (28%) | 235 (41%) | 2,361 (26%) | ||
| Other organisations | 3 (1.4%) | 35 (1.9%) | 11 (1.9%) | 265 (2.9%) | ||
| Other public or mixed entities, created by law whose purpose is to act in the public interest | 2 (0.9%) | 49 (2.7%) | 9 (1.6%) | 219 (2.4%) | ||
| Other sub-national public authorities | 0 (0%) | 9 (0.5%) | 8 (1.4%) | 84 (0.9%) | ||
| Professional consultancies | 1 (0.5%) | 30 (1.7%) | 31 (5.4%) | 601 (6.6%) | ||
| Regional structures | 2 (0.9%) | 9 (0.5%) | 8 (1.4%) | 92 (1.0%) | ||
| Self-employed consultants | 0 (0%) | 15 (0.8%) | 20 (3.5%) | 283 (3.1%) | ||
| Think tanks and research institutions | 6 (2.7%) | 76 (4.2%) | 23 (4.0%) | 482 (5.3%) | ||
| Trade and business associations | 80 (37%) | 552 (30%) | 102 (18%) | 1,716 (19%) | ||
| Trade unions and professional associations | 18 (8.2%) | 151 (8.3%) | 47 (8.2%) | 693 (7.7%) | ||
| Transnational associations and networks of public regional or other sub-national authorities | 5 (2.3%) | 18 (1.0%) | 11 (1.9%) | 52 (0.6%) | ||
| 1 n (%) | ||||||
Resized limits to included dashed line in forest panel`height` was translated to `width`.