# A tibble: 2 × 3
  hasCosts     n percent
     <dbl> <int>   <dbl>
1        0   386     100
2 1 11805 100TR21
Librairies
Imports
Recodage
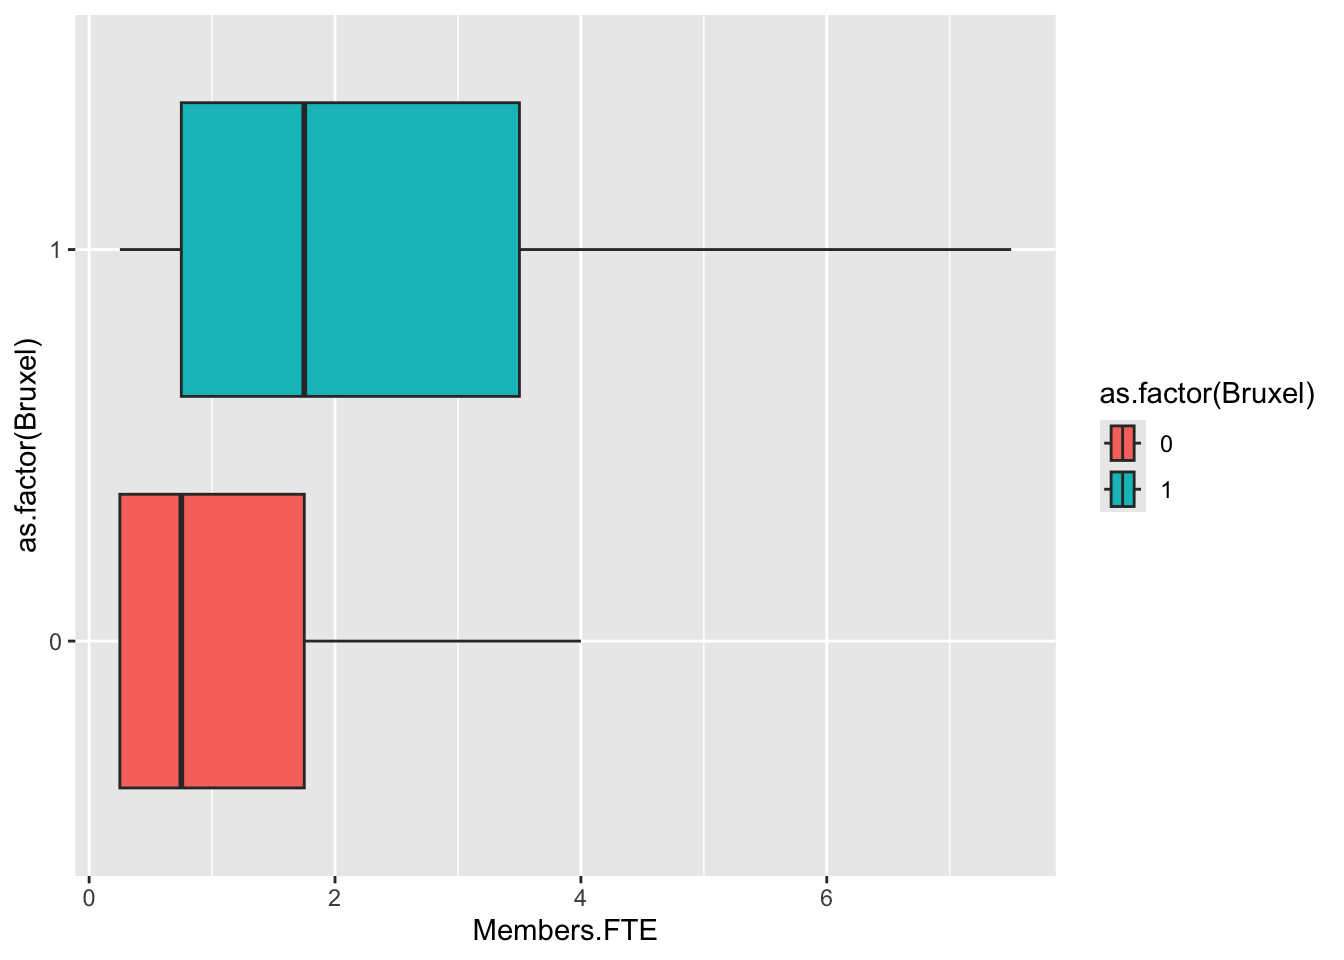
Bruxel
Variables dichotomiques
Traitements
| tmp | n |
|---|---|
| 0 | 11805 |
| 1 | 386 |
| Characteristic | No N = 7,5881 |
Yes N = 4,6031 |
Overall N = 12,1911 |
|---|---|---|---|
| Subsection | |||
| Academic institutions | 10 (2.9%) | 332 (97%) | 342 (100%) |
| Companies & groups | 2,622 (100%) | 0 (0%) | 2,622 (100%) |
| Law firms | 84 (95%) | 4 (4.5%) | 88 (100%) |
| Non-governmental organisations, platforms and networks and similar | 237 (7.2%) | 3,071 (93%) | 3,308 (100%) |
| Organisations representing churches and religious communities | 1 (1.7%) | 58 (98%) | 59 (100%) |
| Other organisations | 330 (100%) | 0 (0%) | 330 (100%) |
| Other public or mixed entities, created by law whose purpose is to act in the public interest | 10 (3.7%) | 261 (96%) | 271 (100%) |
| Other sub-national public authorities | 3 (3.2%) | 92 (97%) | 95 (100%) |
| Professional consultancies | 529 (95%) | 30 (5.4%) | 559 (100%) |
| Regional structures | 7 (6.2%) | 106 (94%) | 113 (100%) |
| Self-employed consultants | 187 (87%) | 28 (13%) | 215 (100%) |
| Think tanks and research institutions | 27 (4.7%) | 551 (95%) | 578 (100%) |
| Trade and business associations | 2,579 (100%) | 0 (0%) | 2,579 (100%) |
| Trade unions and professional associations | 956 (100%) | 0 (0%) | 956 (100%) |
| Transnational associations and networks of public regional or other sub-national authorities | 6 (7.9%) | 70 (92%) | 76 (100%) |
| 1 n (%) | |||
386 missing rows in the "Costs" column have been removed.| Characteristic | 0-24999 N = 4,8371 |
100000-499999 N = 2,9261 |
25000-99999 N = 3,0591 |
500000+ N = 9831 |
Overall N = 11,8051 |
|---|---|---|---|---|---|
| Subsection | |||||
| Non-governmental organisations, platforms and networks and similar | 1,475 (30%) | 677 (23%) | 782 (26%) | 219 (22%) | 3,153 (27%) |
| Companies & groups | 957 (20%) | 720 (25%) | 625 (20%) | 266 (27%) | 2,568 (22%) |
| Trade and business associations | 881 (18%) | 720 (25%) | 709 (23%) | 213 (22%) | 2,523 (21%) |
| Trade unions and professional associations | 440 (9.1%) | 191 (6.5%) | 264 (8.6%) | 46 (4.7%) | 941 (8.0%) |
| Think tanks and research institutions | 216 (4.5%) | 141 (4.8%) | 121 (4.0%) | 82 (8.3%) | 560 (4.7%) |
| Professional consultancies | 192 (4.0%) | 129 (4.4%) | 151 (4.9%) | 63 (6.4%) | 535 (4.5%) |
| Academic institutions | 139 (2.9%) | 82 (2.8%) | 97 (3.2%) | 16 (1.6%) | 334 (2.8%) |
| Other organisations | 152 (3.1%) | 60 (2.1%) | 85 (2.8%) | 14 (1.4%) | 311 (2.6%) |
| Other public or mixed entities, created by law whose purpose is to act in the public interest | 109 (2.3%) | 86 (2.9%) | 55 (1.8%) | 19 (1.9%) | 269 (2.3%) |
| Self-employed consultants | 116 (2.4%) | 3 (0.1%) | 76 (2.5%) | 0 (0%) | 195 (1.7%) |
| Regional structures | 32 (0.7%) | 42 (1.4%) | 17 (0.6%) | 18 (1.8%) | 109 (0.9%) |
| Other sub-national public authorities | 37 (0.8%) | 29 (1.0%) | 15 (0.5%) | 13 (1.3%) | 94 (0.8%) |
| Law firms | 39 (0.8%) | 16 (0.5%) | 25 (0.8%) | 2 (0.2%) | 82 (0.7%) |
| Transnational associations and networks of public regional or other sub-national authorities | 26 (0.5%) | 18 (0.6%) | 19 (0.6%) | 10 (1.0%) | 73 (0.6%) |
| Organisations representing churches and religious communities | 26 (0.5%) | 12 (0.4%) | 18 (0.6%) | 2 (0.2%) | 58 (0.5%) |
| 1 n (%) | |||||
Gros tableau des variables
| Characteristic | Academic institutions N = 3421 |
Companies & groups N = 2,6221 |
Law firms N = 881 |
Non-governmental organisations, platforms and networks and similar N = 3,3081 |
Organisations representing churches and religious communities N = 591 |
Other organisations N = 3301 |
Other public or mixed entities, created by law whose purpose is to act in the public interest N = 2711 |
Other sub-national public authorities N = 951 |
Professional consultancies N = 5591 |
Regional structures N = 1131 |
Self-employed consultants N = 2151 |
Think tanks and research institutions N = 5781 |
Trade and business associations N = 2,5791 |
Trade unions and professional associations N = 9561 |
Transnational associations and networks of public regional or other sub-national authorities N = 761 |
Overall N = 12,1911 |
|---|---|---|---|---|---|---|---|---|---|---|---|---|---|---|---|---|
| Members | 3.0 (1.0, 7.0) - max = 86.0) | 2.0 (1.0, 4.0) - max = 69.0) | 2.0 (1.0, 4.0) - max = 30.0) | 3.0 (1.0, 5.0) - max = 50.0) | 2.0 (1.0, 4.0) - max = 21.0) | 2.0 (1.0, 3.0) - max = 33.0) | 3.0 (1.0, 5.0) - max = 47.0) | 3.0 (1.0, 6.0) - max = 32.0) | 2.0 (1.0, 5.0) - max = 60.0) | 3.0 (2.0, 6.0) - max = 48.0) | 1.0 (1.0, 1.0) - max = 6.0) | 3.0 (2.0, 7.0) - max = 49.0) | 2.0 (1.0, 4.0) - max = 84.0) | 2.0 (1.0, 4.0) - max = 30.0) | 3.0 (2.0, 6.0) - max = 38.0) | 2.0 (1.0, 4.0) - max = 86.0) |
| Members.FTE | 1.13 (0.50, 3.00) - max = 86.00) | 0.75 (0.25, 1.75) - max = 52.00) | 0.88 (0.25, 1.75) - max = 30.00) | 1.00 (0.50, 2.50) - max = 39.75) | 1.00 (0.50, 2.50) - max = 16.00) | 0.75 (0.25, 1.50) - max = 33.00) | 1.00 (0.50, 2.50) - max = 43.75) | 1.50 (0.50, 4.50) - max = 15.50) | 1.25 (0.50, 3.25) - max = 49.50) | 2.00 (0.75, 6.00) - max = 25.00) | 0.75 (0.25, 1.00) - max = 5.50) | 1.50 (0.50, 3.75) - max = 37.00) | 1.00 (0.50, 2.00) - max = 42.00) | 0.75 (0.25, 1.75) - max = 22.25) | 1.63 (0.75, 3.38) - max = 38.00) | 1.00 (0.50, 2.00) - max = 86.00) |
| Number.of.EP.accredited.persons | 1.00 (1.00, 2.00) - max = 3.00) | 2.00 (1.00, 3.00) - max = 9.00) | 2.00 (1.00, 4.00) - max = 7.00) | 2.00 (1.00, 2.00) - max = 11.00) | 1.00 (1.00, 2.00) - max = 4.00) | 1.00 (1.00, 2.00) - max = 15.00) | 1.00 (1.00, 2.00) - max = 4.00) | 1.50 (1.00, 4.50) - max = 7.00) | 2.00 (1.00, 5.00) - max = 25.00) | 1.00 (1.00, 3.00) - max = 4.00) | 1.00 (1.00, 1.00) - max = 1.00) | 1.00 (1.00, 2.00) - max = 8.00) | 2.00 (1.00, 3.00) - max = 21.00) | 2.00 (1.00, 3.00) - max = 12.00) | 1.00 (1.00, 2.50) - max = 3.00) | 1.00 (1.00, 3.00) - max = 25.00) |
| Unknown | 330 | 2,316 | 74 | 2,976 | 46 | 309 | 252 | 91 | 432 | 106 | 175 | 524 | 2,220 | 880 | 68 | 10,799 |
| Costs | ||||||||||||||||
| 0-24999 | 139 (2.9%) | 957 (20%) | 39 (0.8%) | 1,475 (30%) | 26 (0.5%) | 152 (3.1%) | 109 (2.3%) | 37 (0.8%) | 192 (4.0%) | 32 (0.7%) | 116 (2.4%) | 216 (4.5%) | 881 (18%) | 440 (9.1%) | 26 (0.5%) | 4,837 (100%) |
| 100000-499999 | 82 (2.8%) | 720 (25%) | 16 (0.5%) | 677 (23%) | 12 (0.4%) | 60 (2.1%) | 86 (2.9%) | 29 (1.0%) | 129 (4.4%) | 42 (1.4%) | 3 (0.1%) | 141 (4.8%) | 720 (25%) | 191 (6.5%) | 18 (0.6%) | 2,926 (100%) |
| 25000-99999 | 97 (3.2%) | 625 (20%) | 25 (0.8%) | 782 (26%) | 18 (0.6%) | 85 (2.8%) | 55 (1.8%) | 15 (0.5%) | 151 (4.9%) | 17 (0.6%) | 76 (2.5%) | 121 (4.0%) | 709 (23%) | 264 (8.6%) | 19 (0.6%) | 3,059 (100%) |
| 500000+ | 16 (1.6%) | 266 (27%) | 2 (0.2%) | 219 (22%) | 2 (0.2%) | 14 (1.4%) | 19 (1.9%) | 13 (1.3%) | 63 (6.4%) | 18 (1.8%) | 0 (0%) | 82 (8.3%) | 213 (22%) | 46 (4.7%) | 10 (1.0%) | 983 (100%) |
| Unknown | 8 | 54 | 6 | 155 | 1 | 19 | 2 | 1 | 24 | 4 | 20 | 18 | 56 | 15 | 3 | 386 |
| Bruxel | 42 (1.2%) | 531 (15%) | 45 (1.3%) | 886 (26%) | 36 (1.0%) | 88 (2.5%) | 56 (1.6%) | 36 (1.0%) | 241 (6.9%) | 53 (1.5%) | 65 (1.9%) | 145 (4.2%) | 974 (28%) | 248 (7.1%) | 27 (0.8%) | 3,473 (100%) |
| In_intergroup | 36 (2.3%) | 332 (21%) | 2 (0.1%) | 515 (33%) | 19 (1.2%) | 27 (1.7%) | 20 (1.3%) | 9 (0.6%) | 62 (3.9%) | 15 (0.9%) | 24 (1.5%) | 58 (3.7%) | 332 (21%) | 118 (7.5%) | 11 (0.7%) | 1,580 (100%) |
| In_EG | 59 (2.9%) | 357 (18%) | 10 (0.5%) | 535 (26%) | 1 (<0.1%) | 45 (2.2%) | 45 (2.2%) | 5 (0.2%) | 30 (1.5%) | 9 (0.4%) | 8 (0.4%) | 88 (4.3%) | 627 (31%) | 190 (9.4%) | 17 (0.8%) | 2,026 (100%) |
| Has_EP_access | 12 (0.9%) | 306 (22%) | 14 (1.0%) | 332 (24%) | 13 (0.9%) | 21 (1.5%) | 19 (1.4%) | 4 (0.3%) | 127 (9.1%) | 7 (0.5%) | 40 (2.9%) | 54 (3.9%) | 359 (26%) | 76 (5.5%) | 8 (0.6%) | 1,392 (100%) |
| Has_EU_grants | 238 (9.2%) | 470 (18%) | 5 (0.2%) | 975 (38%) | 4 (0.2%) | 56 (2.2%) | 100 (3.9%) | 40 (1.5%) | 40 (1.5%) | 35 (1.3%) | 3 (0.1%) | 242 (9.3%) | 254 (9.8%) | 98 (3.8%) | 35 (1.3%) | 2,595 (100%) |
| 1 Median (Q1, Q3) - max = 100% Centile) ; n (%) | ||||||||||||||||
Test sur Bruxelle